


Executive Summary
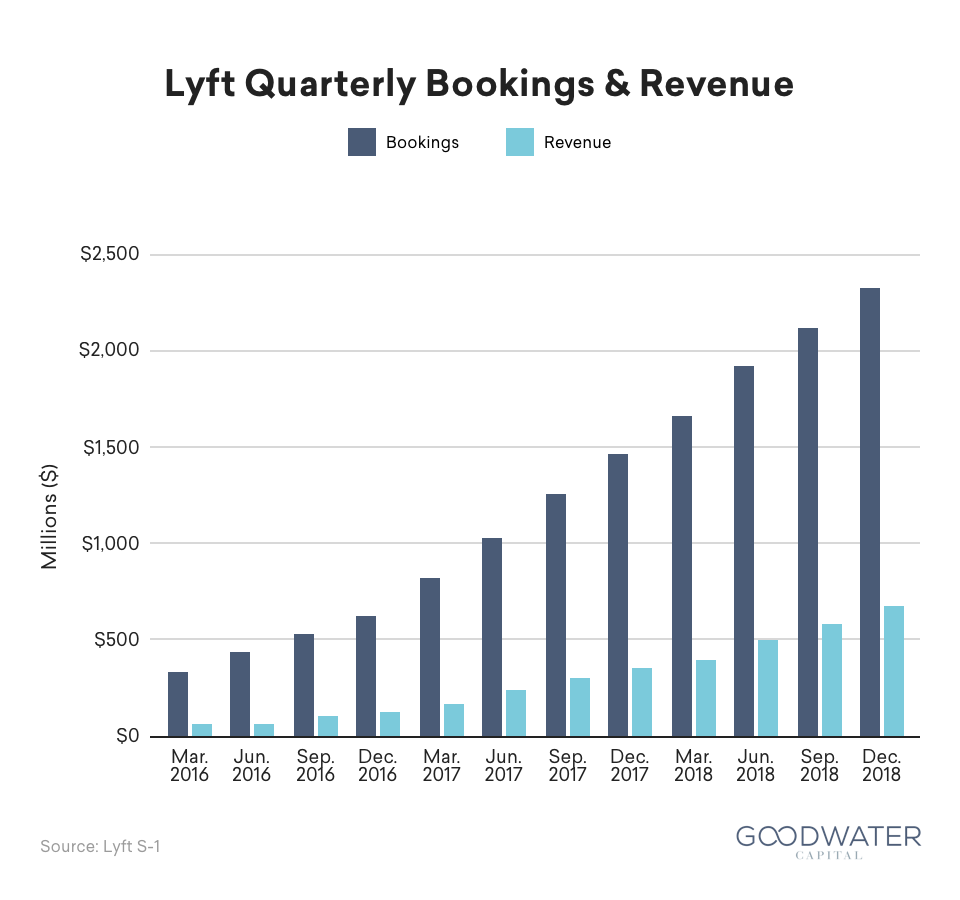
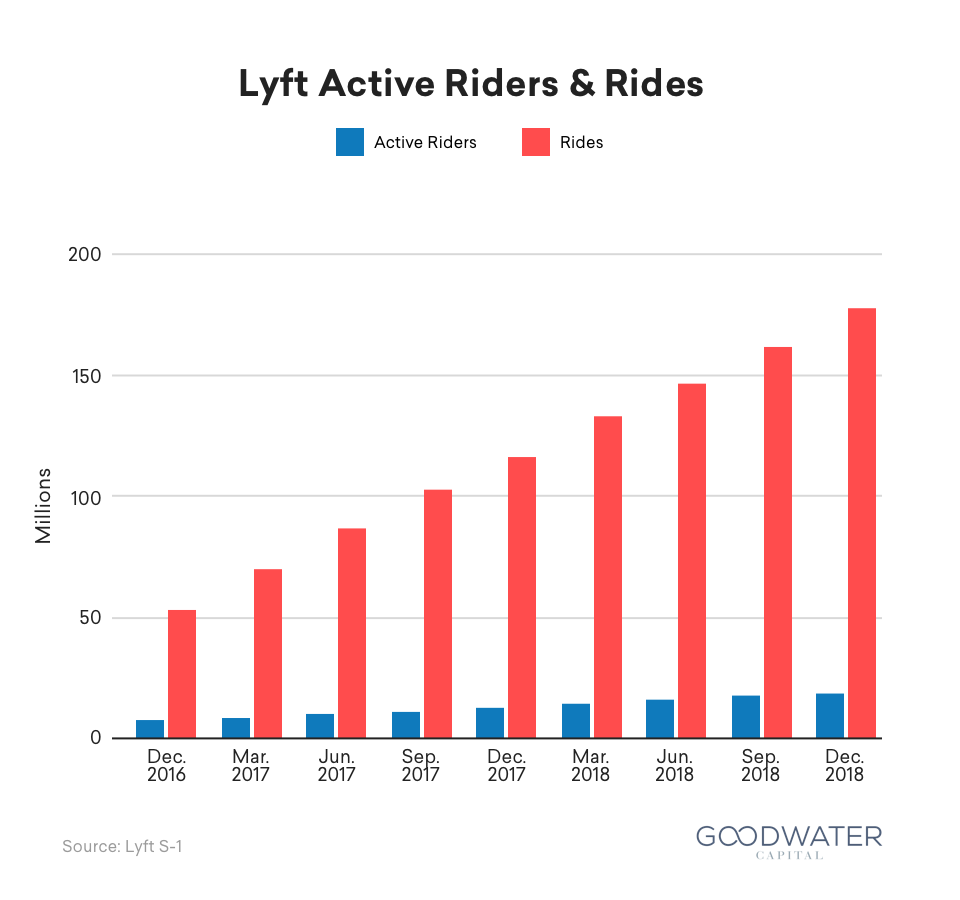
Lyft is one of the largest and fastest-growing multimodal transportation networks in the United States and Canada. Founded in 2012, the company has facilitated over 1 billion rides, and as of December 31, 2018, boasts over 18.6 million active riders and 1.1 million drivers in over 300 markets.1 From 2016 to 2018, the company increased revenue from $343.3 million to $2.2 billion, and grew bookings from $1.9 billion to $8.1 billion.2 Lyft played a key role in transforming how consumers perceive transportation networks, and has gained significant market share through cultivating an authentic brand, leveraging advantageous market dynamics, and focusing its execution on revolutionizing how people get to their desired destinations. As Lyft enters a new phase of growth post-IPO, the company will be focused on expanding relationships with existing customers, innovating by investing in disruptive technologies, and reducing costs to achieve profitability.
Winning Strategies
What can founders learn from Lyft’s path to IPO?
- Focus deeply on a problem and iterate. From the beginning, Lyft founders Logan Green and John Zimmer had a clear goal of improving lives through revolutionizing transportation. Prior to Lyft, the duo spent 5 years building Zimride, a carpool service which helped university students share rides home during the holidays. Zimride started out selling enterprise licenses to universities and businesses, but after years of slow growth, they decided to focus on consumers. However, even with the new plan in place, adoption was slow.3 After iterating through several more ideas, the team eventually settled on “Zimride Instant,” which allowed users to request rides from community members via their mobile phone. This product became Lyft. With Lyft’s 2012 launch, the company pioneered peer-to-peer ridesharing as we know it today.
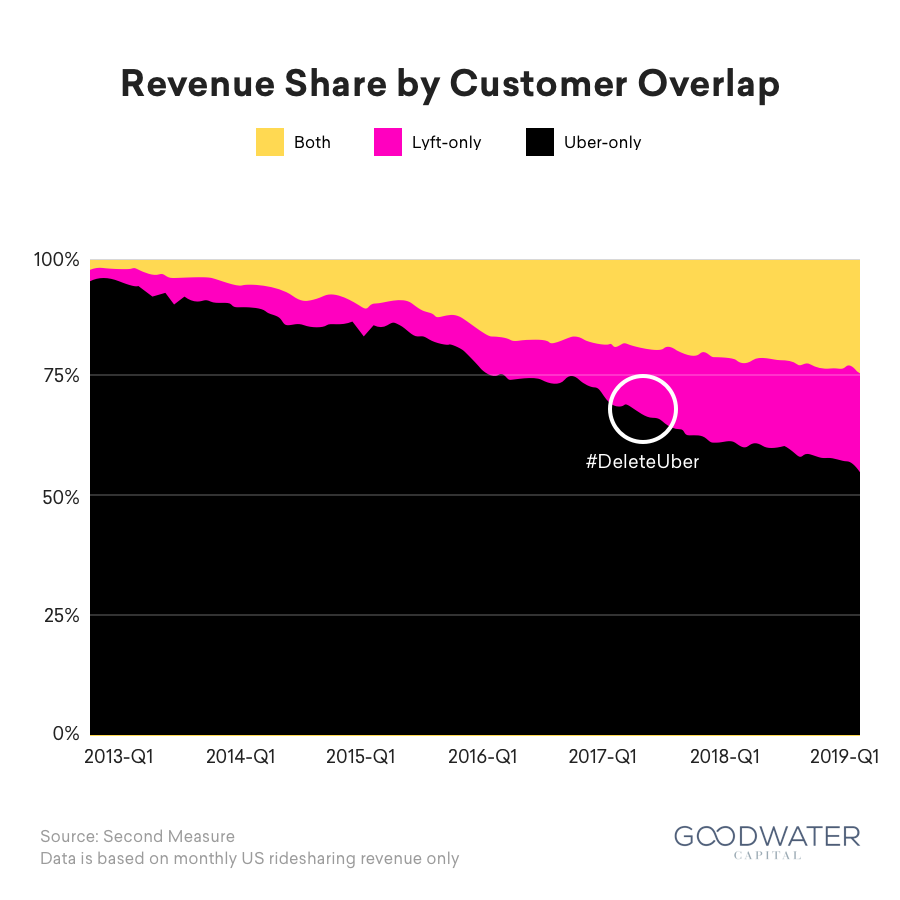
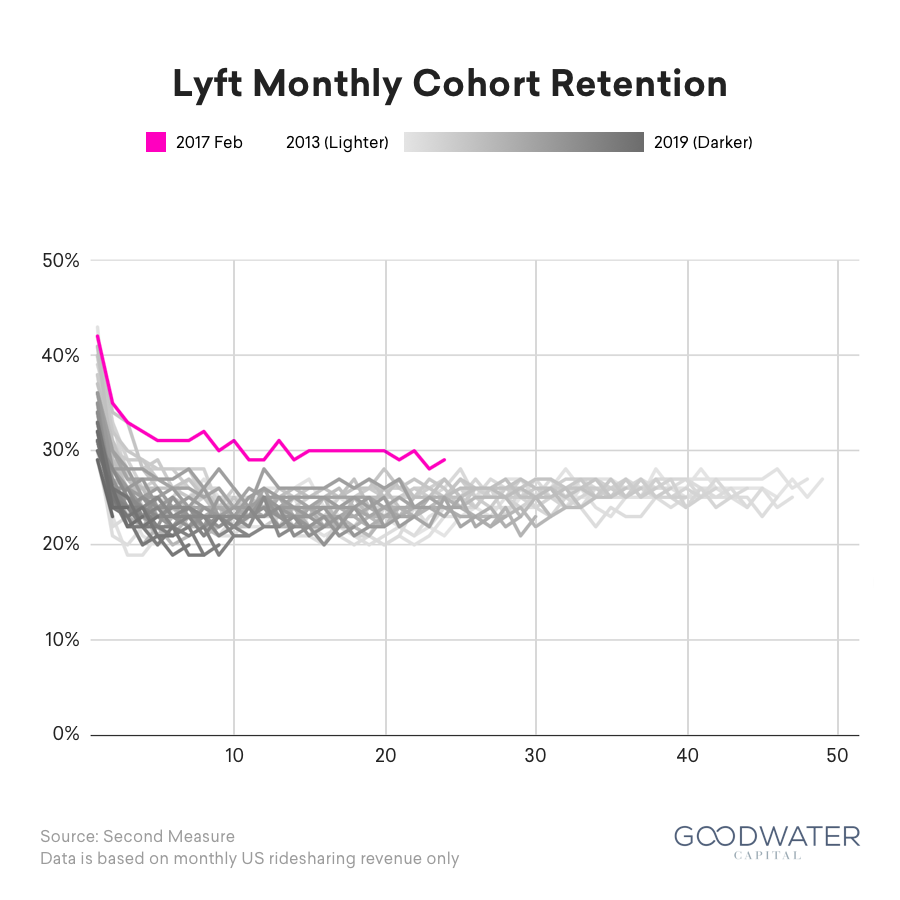
- Develop a differentiated brand strategy that resonates with target customers. To differentiate in a price-competitive market, Lyft created an authentic, values-driven brand that appealed to a community of younger, socially conscious consumers.4 From its earliest days, Lyft put an emphasis on how customers were treated and how its drivers were perceived; drivers were encouraged to “fist bump” riders and invite them to sit in the front to foster friendly conversation.5 Lyft’s positioning as “your friend with a car” starkly contrasted with Uber’s on-demand black car service where riders expected to ride in the back and be “chauffeured” to their destination. Lyft’s focus on younger users who value its friendlier and progressive messaging paid off in the form of faster growth among younger users versus Uber.6 Research reveals that 89% of millennials are likely to switch to brands associated with a good cause given similar price and quality.7 Lyft capitalized on this trend with heavily publicized campaigns highlighting its social responsibility bonafides. For example, a $1 million donation to the ACLU in the wake of one of Donald Trump’s immigration orders led to an almost instantaneous 7% bump in users.8 While Uber was mired in multiple scandals, Lyft gained traction with a sudden increase in market share and an extra sticky cohort of users that joined during February 2017’s #DeleteUber movement.
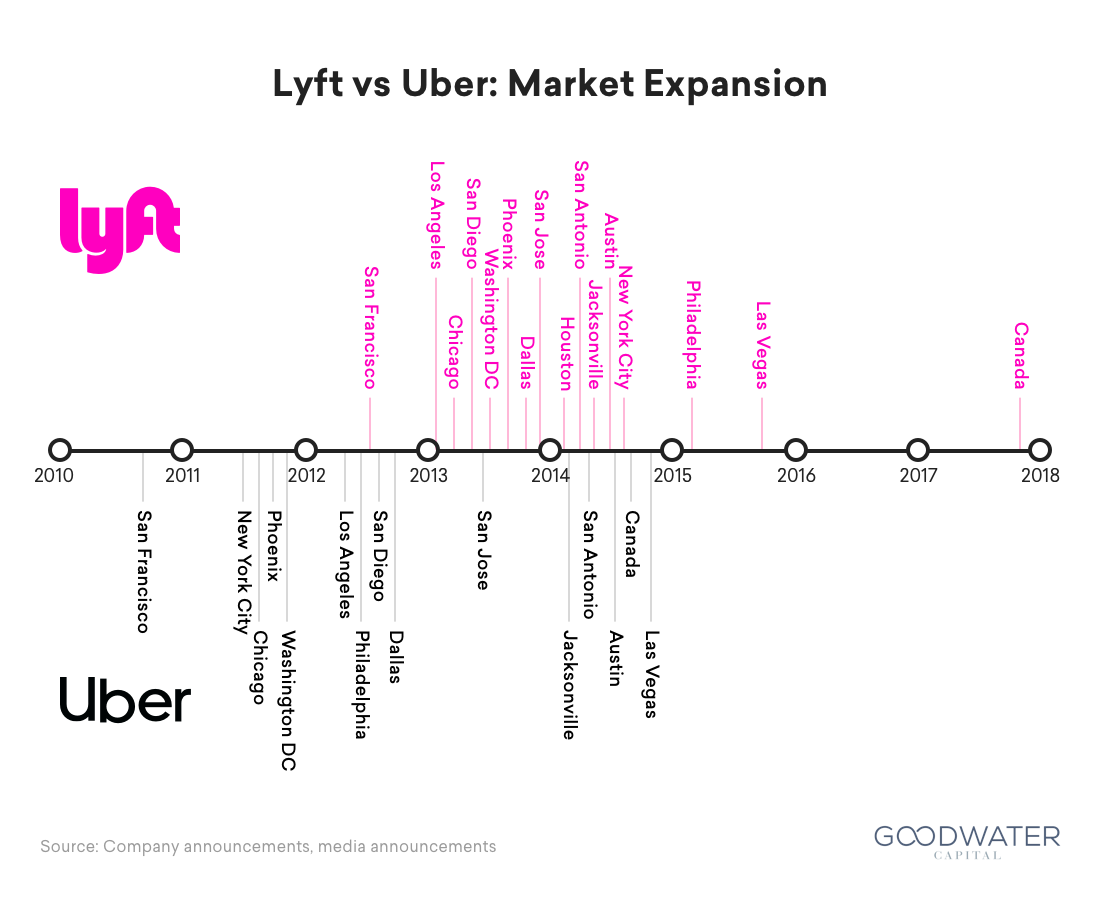
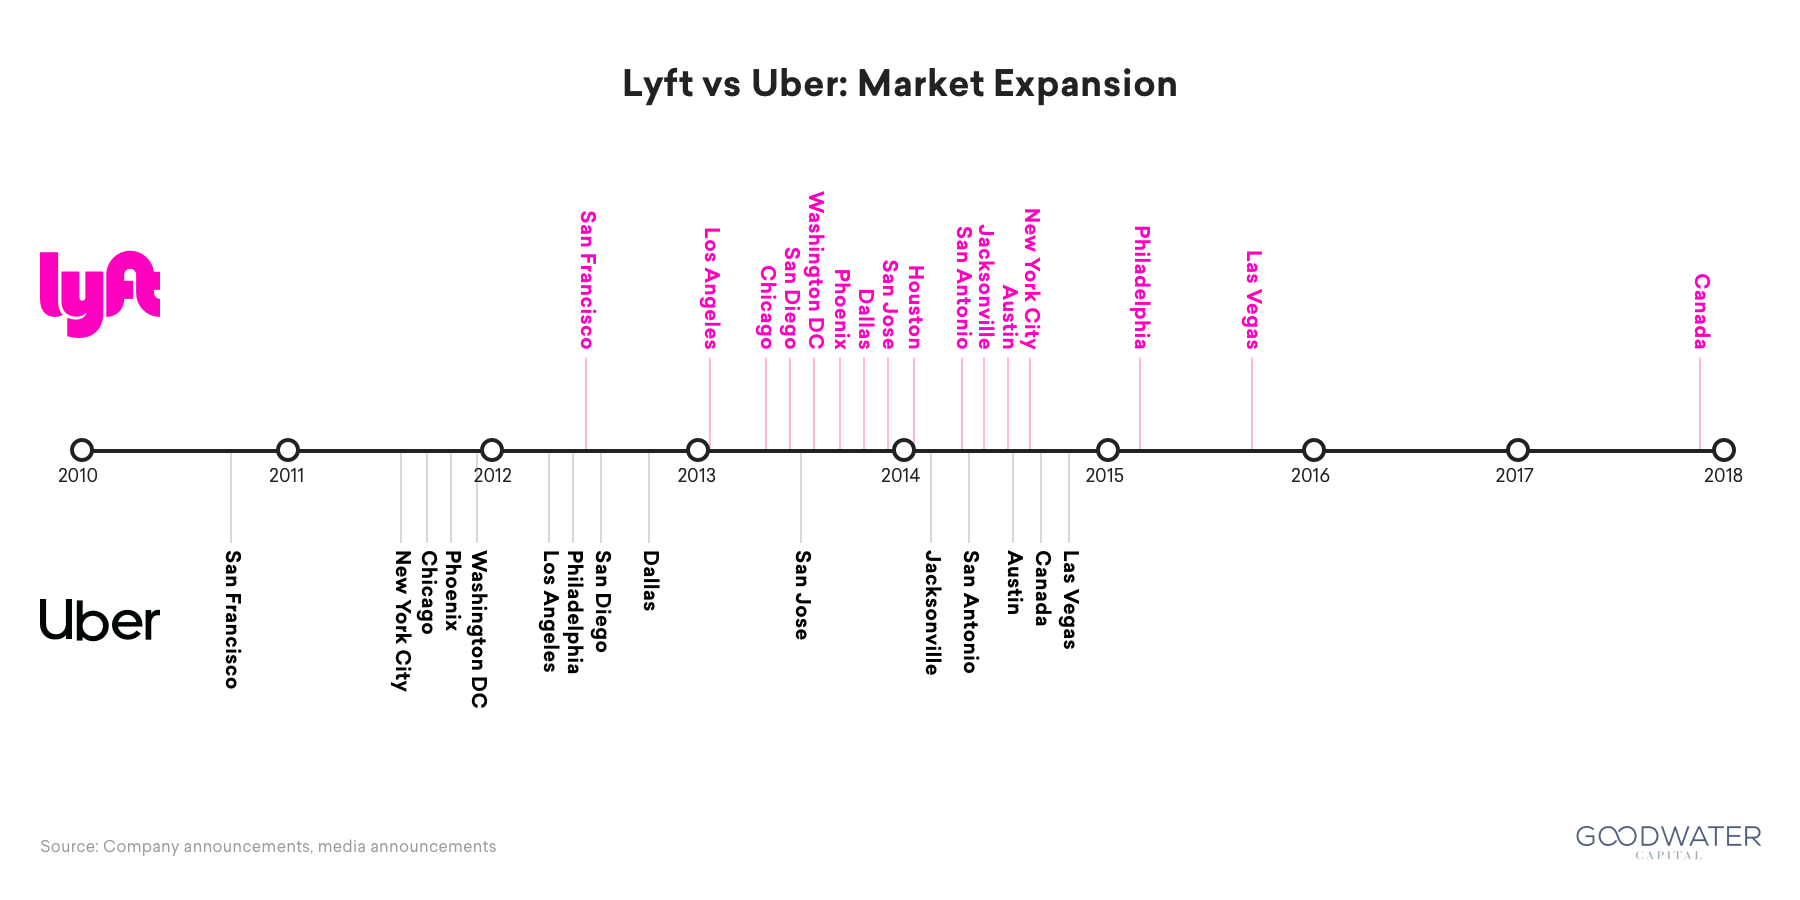
- Utilize lessons learned by early entrants in local marketplaces. Ridesharing is a uniquely difficult business to scale due to local regulations, driver recruitment, and dependency on offline components like cars. A new entrant to an untapped market will often pay a steep price in terms of money, talent and effort while establishing a presence. In many markets, Uber paved the way by educating the market, onboarding drivers, and working through regulations with local stakeholders. Though Uber arrived first in said markets, Lyft was able to take advantage of Uber’s groundwork to quickly get its own operations up to speed. Lyft executed efficiently and drafted behind Uber as it expanded, enabling Lyft to close the gap on market share and product differentiation.
The Next Level
How does Lyft continue on a path toward market leadership?
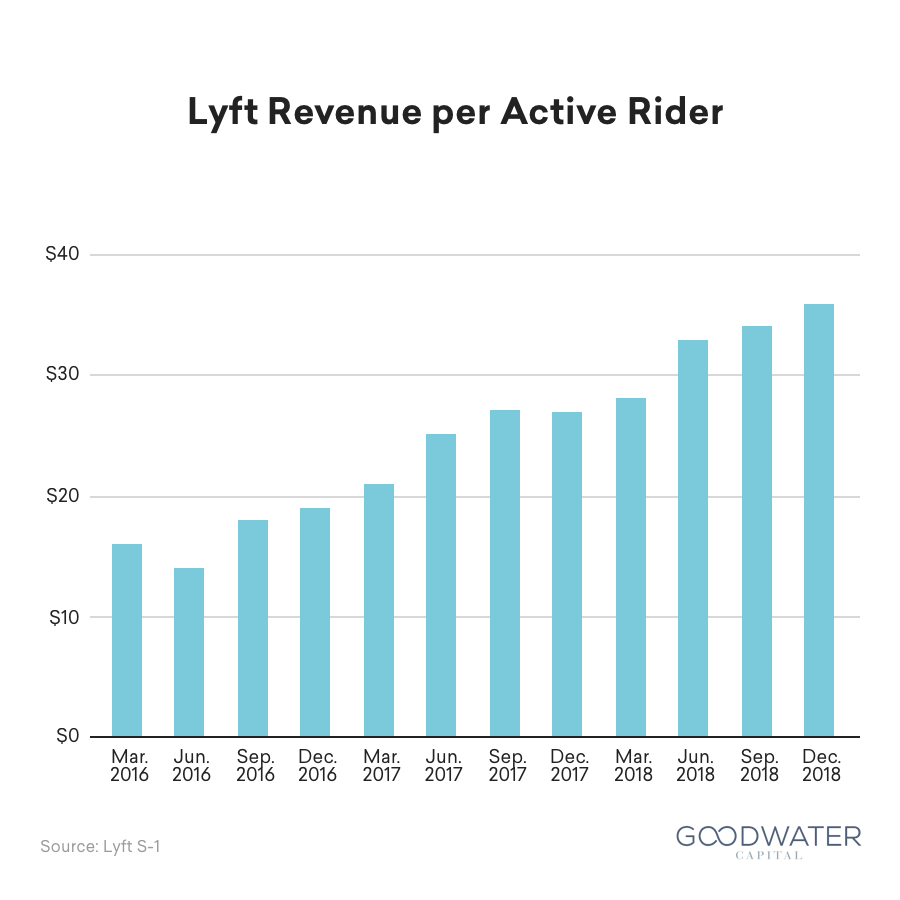
- Expand the relationship with existing customers. While Lyft benefits from a rider-driver network effect in its business, not all network effects are created equal. Winner-take-all dynamics are difficult in ridesharing because local networks are isolated, government regulation varies widely, and dependency on physical components limits the economies of scale for any one player. Furthermore, switching costs are low for both riders and drivers – as simple as opening up a different app on their phone. In a market with these weak-form network effects, Lyft needs to expand on its value proposition and increase the depth of engagement with existing customers. Lyft started expanding engagement with users through public transportation integrations, micromobility solutions (bikes and scooters), and business services (Concierge), generating $36.04 in net revenue per active rider in Q4 2018. Lyft can capture and grow a loyal customer base by continuing to extend its travel use cases, forging strategic partnerships, and growing its share of rider transportation spend,9 while continuing to elevate its socially conscious and progressive brand. Amazon represents one example of prioritizing expanding engagement over geographical growth. The retail behemoth started with books, and gradually branched out to new businesses that built on the initial solid relationships with customers.10
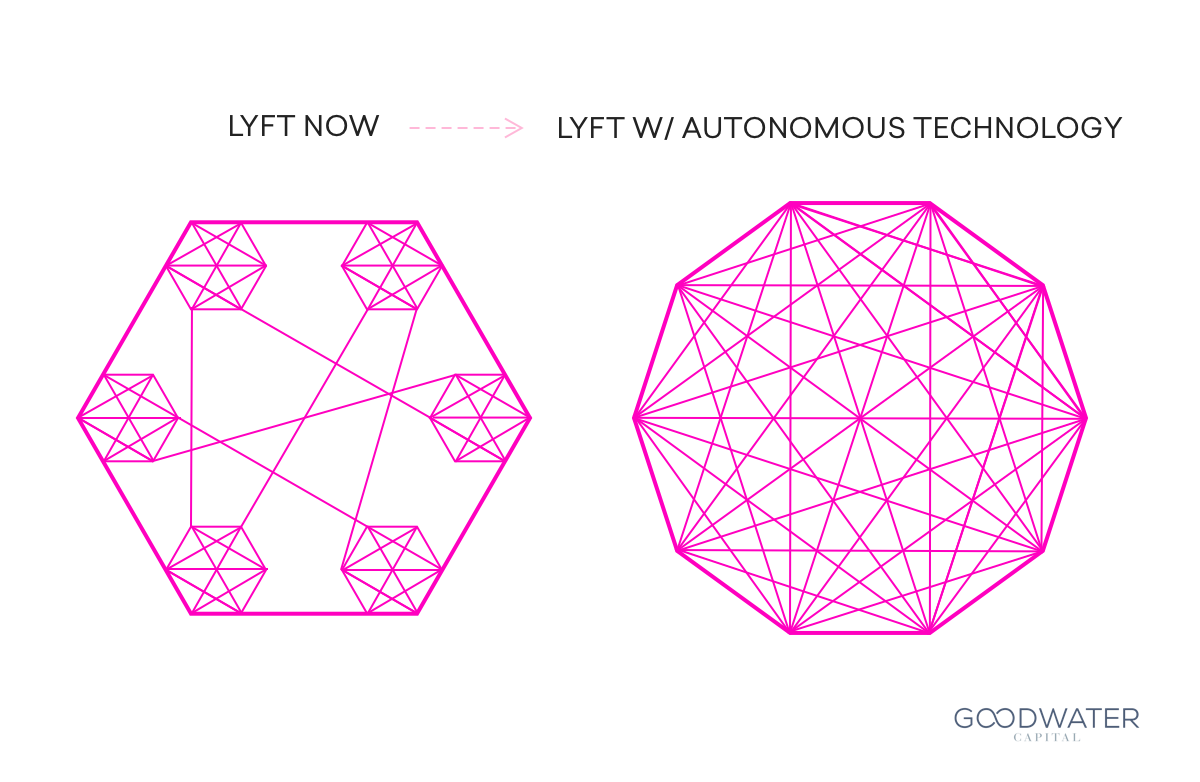
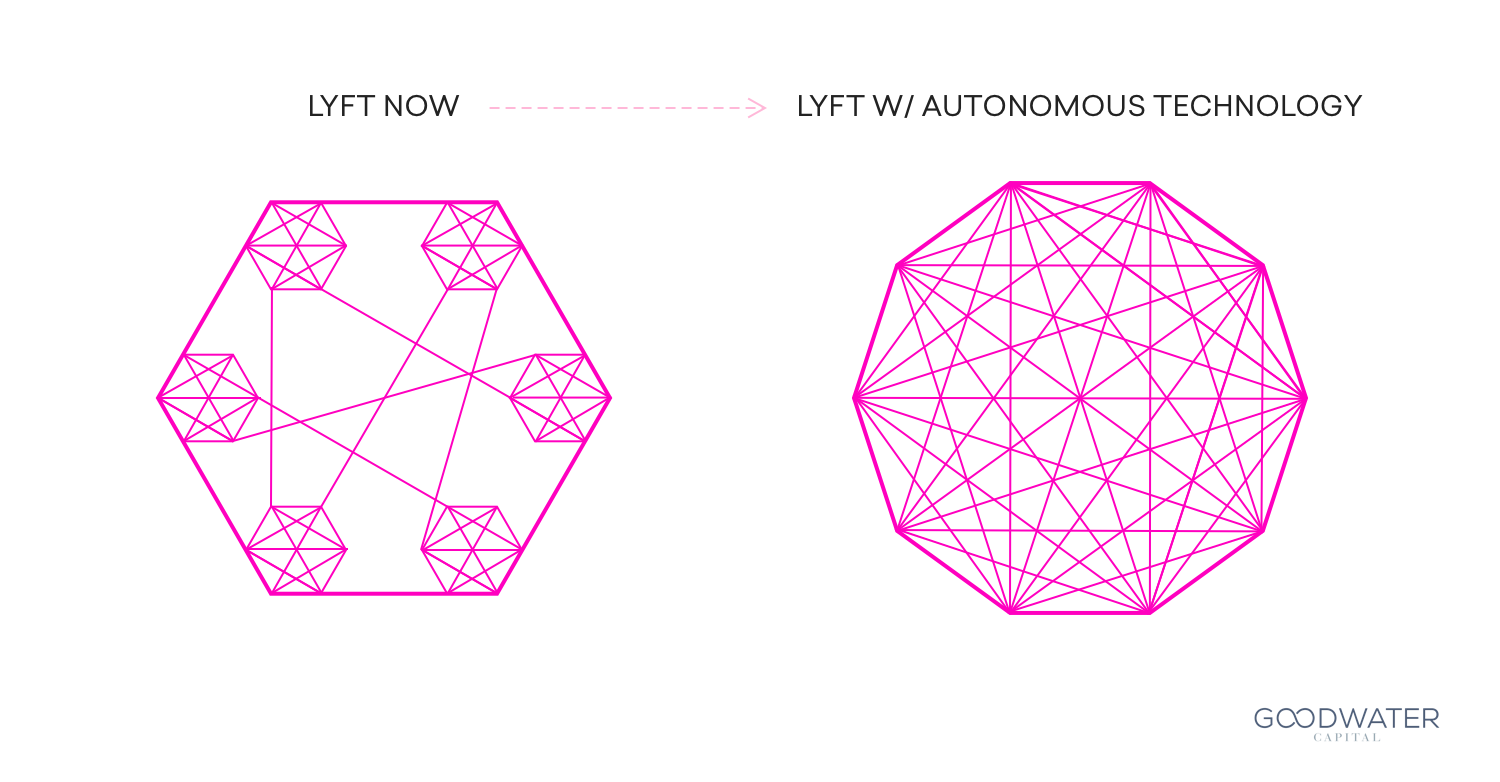
- Innovate by investing in disruptive technologies. Breakthrough technologies can provide a huge competitive advantage. Autonomous vehicles have the potential to transform the business by removing human driver dependency, reducing cost, and increasing utilization. One of the largest expenses for Lyft is its workforce of independent contractor drivers, who have collectively received over $10 billion in earnings.11 Autonomous technology represents a major opportunity for Lyft to leapfrog competitors who are pursuing very different approaches. While ridesharing today is hamstrung by limited local network effects, autonomous cars will unlock unprecedented opportunities for generating data that informs dispatch, routing, and feedback across the entire network. The shift toward autonomy will push ridesharing toward a commoditized market, in which expertise in driver recruitment, where network effects are most pronounced, will become irrelevant. In a commoditized market, Lyft’s valuable, trusted brand may be perceived as attractive and advantageous in a driverless ridesharing world.
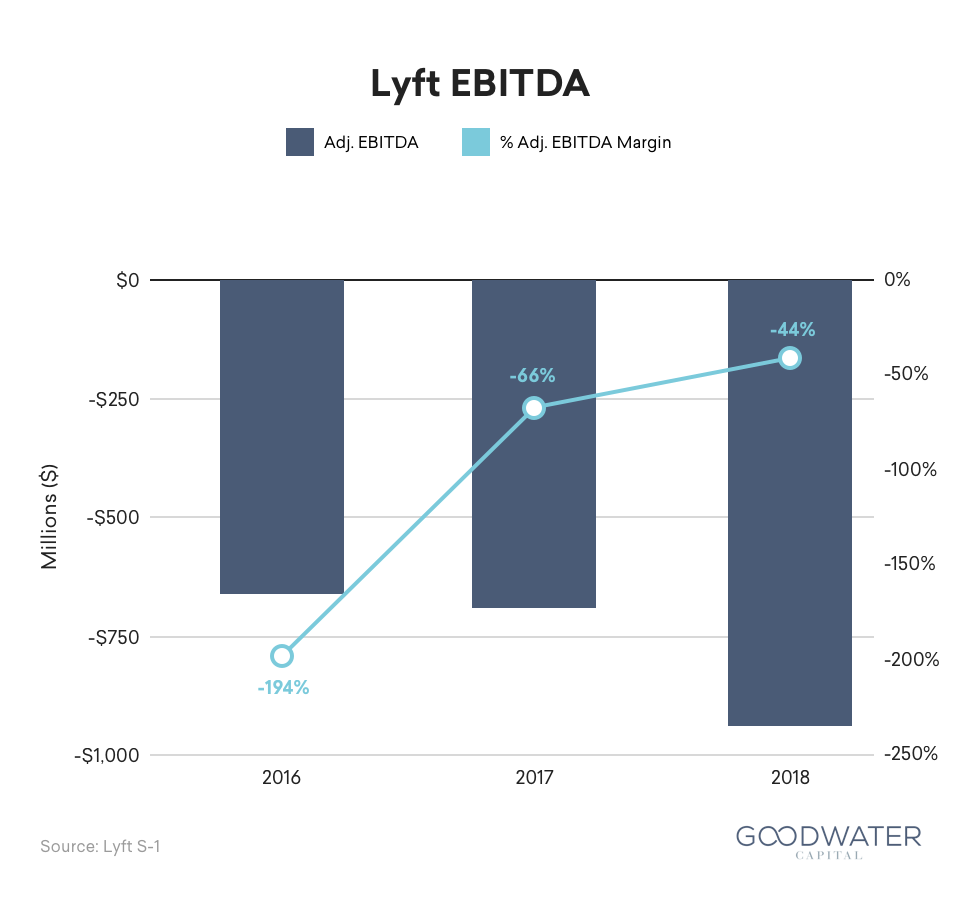
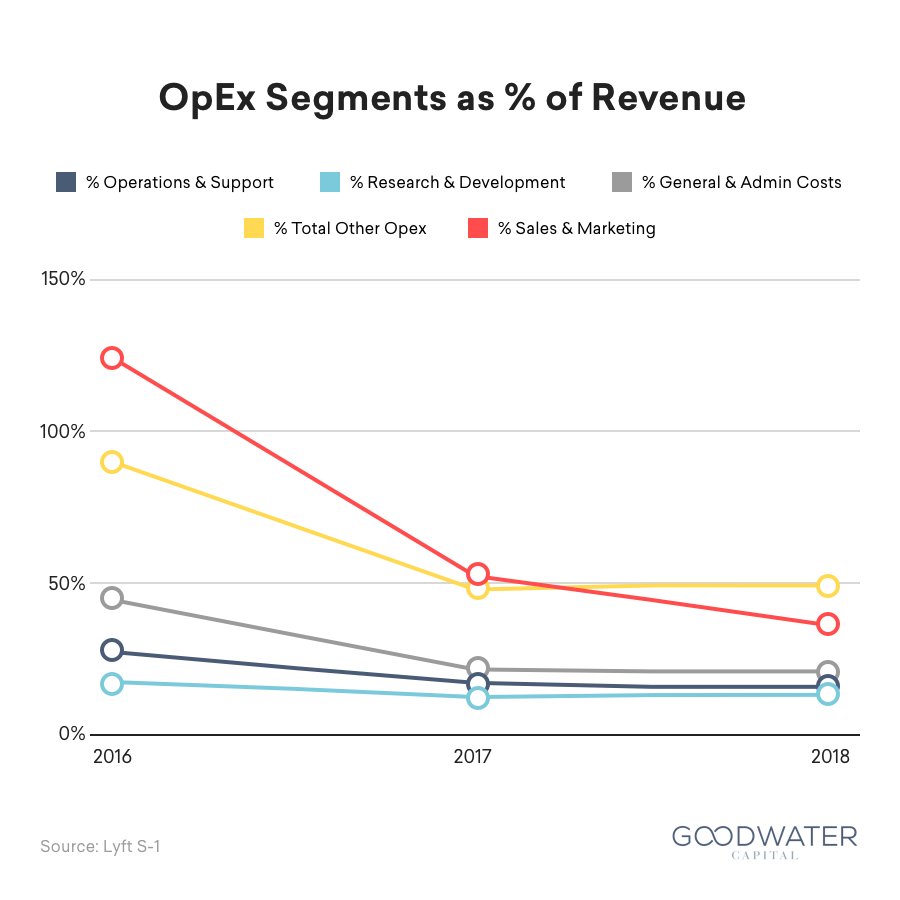
- Lower costs to achieve profitability. After posting a loss of $911 million in 2018,12 Lyft must reduce variable costs and improve operating leverage by growing rides and revenue to reach profitability. Lyft has worked towards that goal by improving adjusted gross margins13 from 24% in 2016 to 43% in 2018. However, Lyft can still enhance its gross margins, especially by lowering insurance costs (one of the largest contributors to cost of revenue). By leveraging economies of scale, Lyft should be able to counteract insurance costs that have shot up due to increased frequency and severity of insurance claims.14 Lyft also needs to continue growing its rider base by increasing brand awareness and facilitating word of mouth to drive organic adoption, lowering sales and marketing costs. Another area of focus is Lyft’s other operating expenses (excluding marketing), which shrank as a percent of revenue from 2016 to 2017, but remained flat in 2018 at 50% despite revenue growing 103% year over year.15 Therefore, even if Lyft were to reduce marketing spend to $0 in 2018, the business would have still operated at a loss due to the high operating expenses and today’s gross margin structure.
Business Overview
Background. Lyft’s mission is to “improve people’s lives with the world’s best transportation.” The company, which was founded back in 2012, viewed social responsibility as a key part of the brand. Led by visionary co-founders Logan Green and John Zimmer, Lyft quickly prioritized the creation of an authentic corporate image along with a set of socially-conscious values. With a solid foundation, they hoped to free people from the stresses and financial constraints of car ownership.
The problem. As the population expanded over the course of the 20th century, more and more people bought cars for both work and pleasure. However, traffic congestion and urban growth made driving and owning a car a less efficient and convenient proposition.
The answer. Lyft’s solution to the problem consists of redefining how Americans travel by offering up Transportation as a Service (TaaS) in the form of a seamless, connected transportation network. Lyft’s current multimodal platform is comprised of several different forms of transport:
- The ridesharing marketplace
- Bikes and scooters
- Public transit integrations
- Autonomous vehicles
While the ridesharing marketplace may be the most prominent aspect of the service, bikes and scooters have quickly gained ground. The company first launched Lyft Scooters in Denver back in September of 2018,16 and decided to expand its bicycle-sharing platform by acquiring Motivate for $250.9 million in November of 2018.17
The marketplace. When a user wants a ride, several taps in the distinctive pink-themed app and minutes later their desired transport arrives to whisk them off to their destination. To create this magical experience, data driven insights play a key role in advancing the company’s effectiveness in pairing riders with drivers and personalizing the user’s experience.
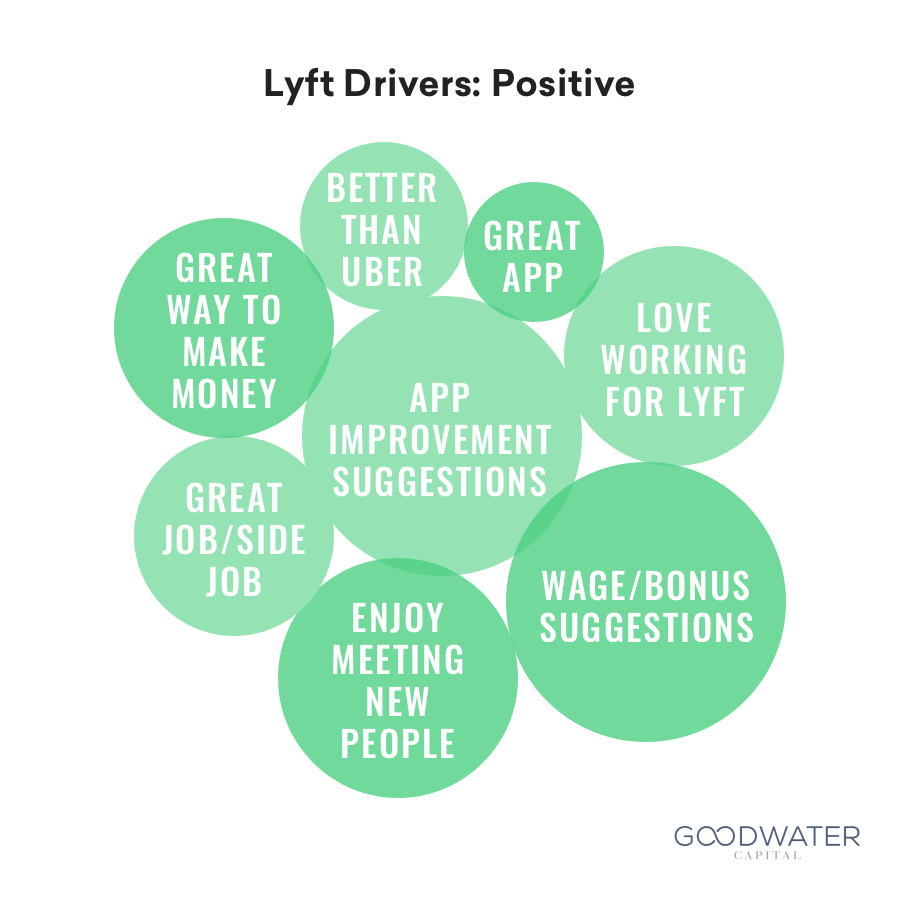
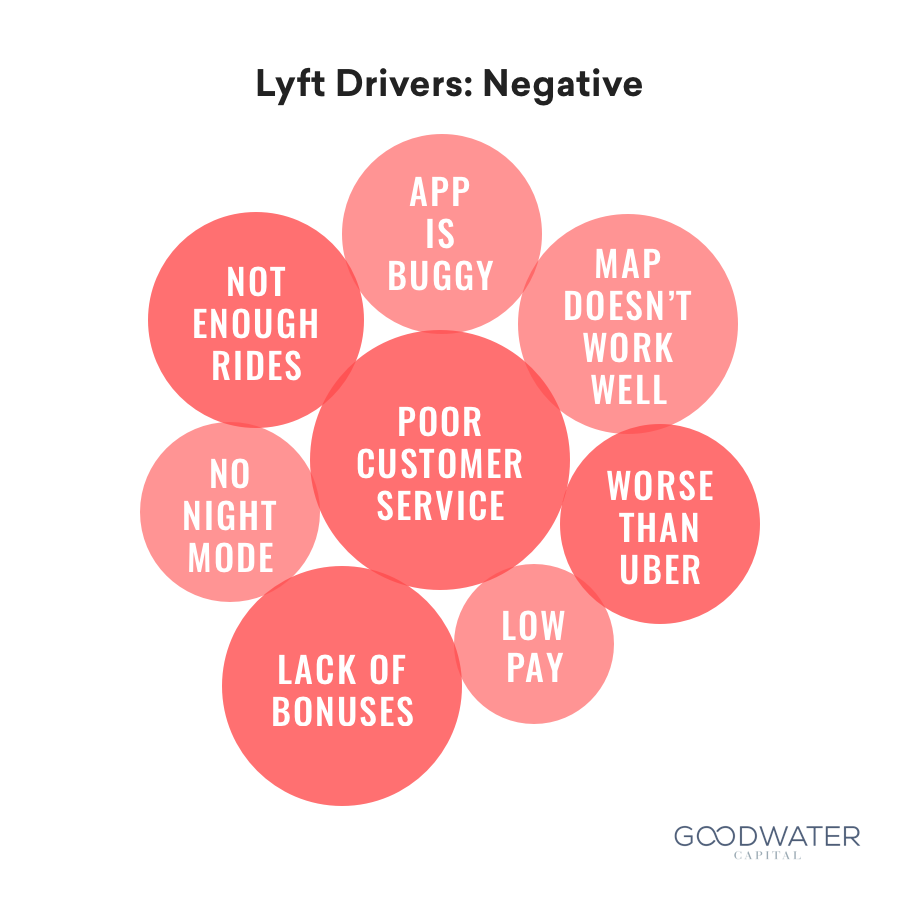
- Driver experience. Customer facing performance is largely tied to the platform’s ability to attract and retain quality drivers, as drivers are the main service provider with which riders interact. Lyft’s dedication to its drivers led it to innovate by introducing tipping and providing generous driver incentives. Goodwater’s word clouds analyze customer review data to provide insight into how products are used and which aspects users like and dislike. Lyft drivers indicate they enjoy the opportunities that ridesharing services provide and the ability to earn money on their own schedule. On the other hand, drivers are frustrated by not receiving enough ride requests, app malfunctions, low pay, and poor customer service; “night mode” is a commonly requested feature.
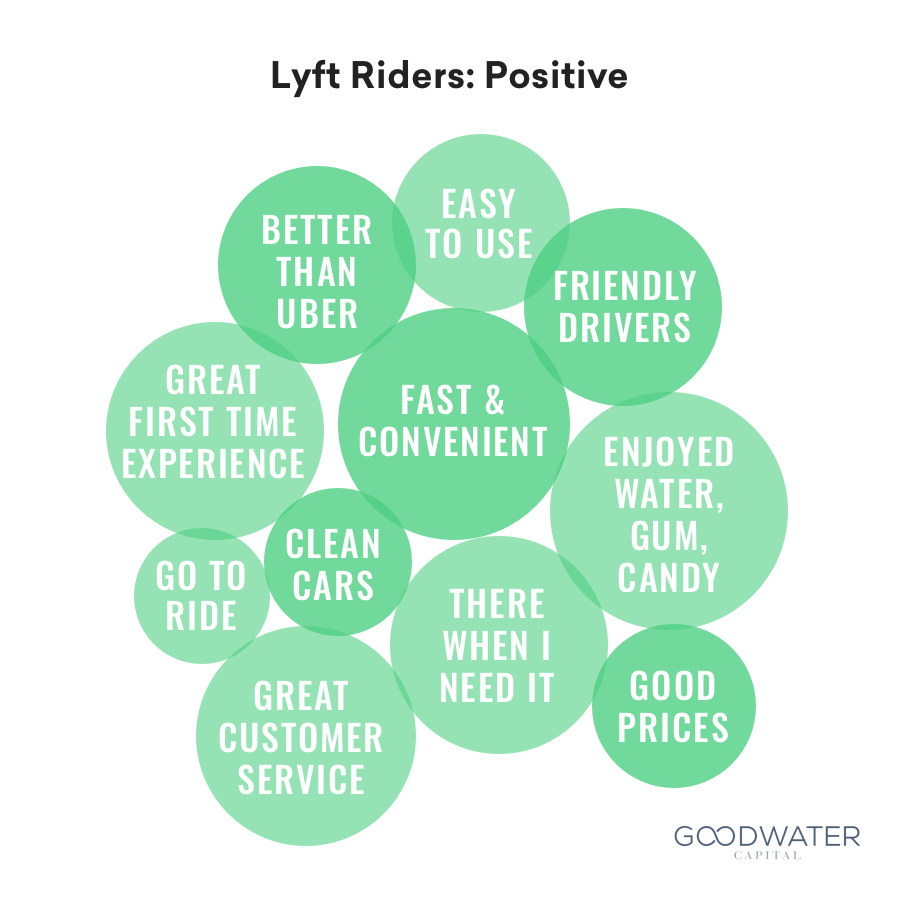
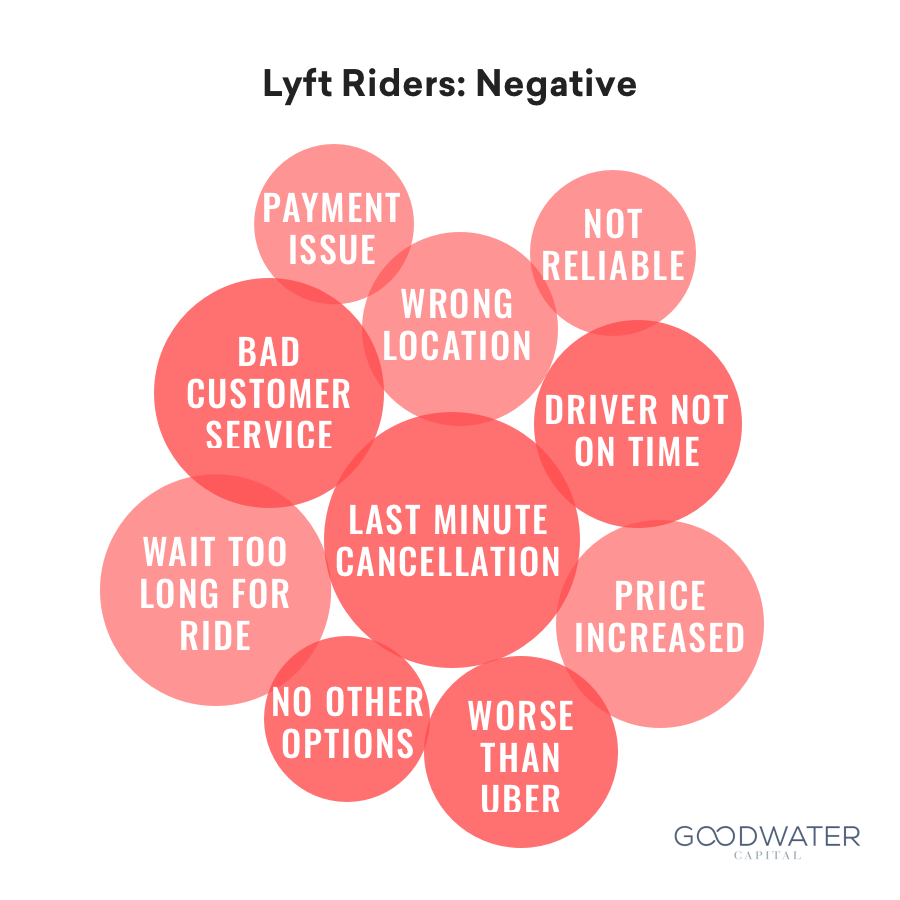
- Rider experience. Riders are experiencing remarkable changes to their transportation patterns thanks to ridesharing, with 46% of users reporting that they utilize their car less because of the service.18 Lyft claims their area of operations now covers over 95% of the US population.19 Lyft riders love when drivers provide a superior experience thanks to clean vehicles and extras such as water, gum and candy. They also appreciate great customer service and an easy first time experience for new users. Negative sentiments included problems with drivers canceling trips, excessive driver switching, long wait times, bad customer service and app-specific issues.
Consumer Research
Survey panel. Goodwater conducts proprietary consumer research to identify consumer insights and trends. Every quarter, Goodwater runs a consumer survey across a panel of consumers representing census-balanced ages,20 demographics, and geographies of the US.21 We systematically track the usage of hundreds of products and compare market share changes between competing products.
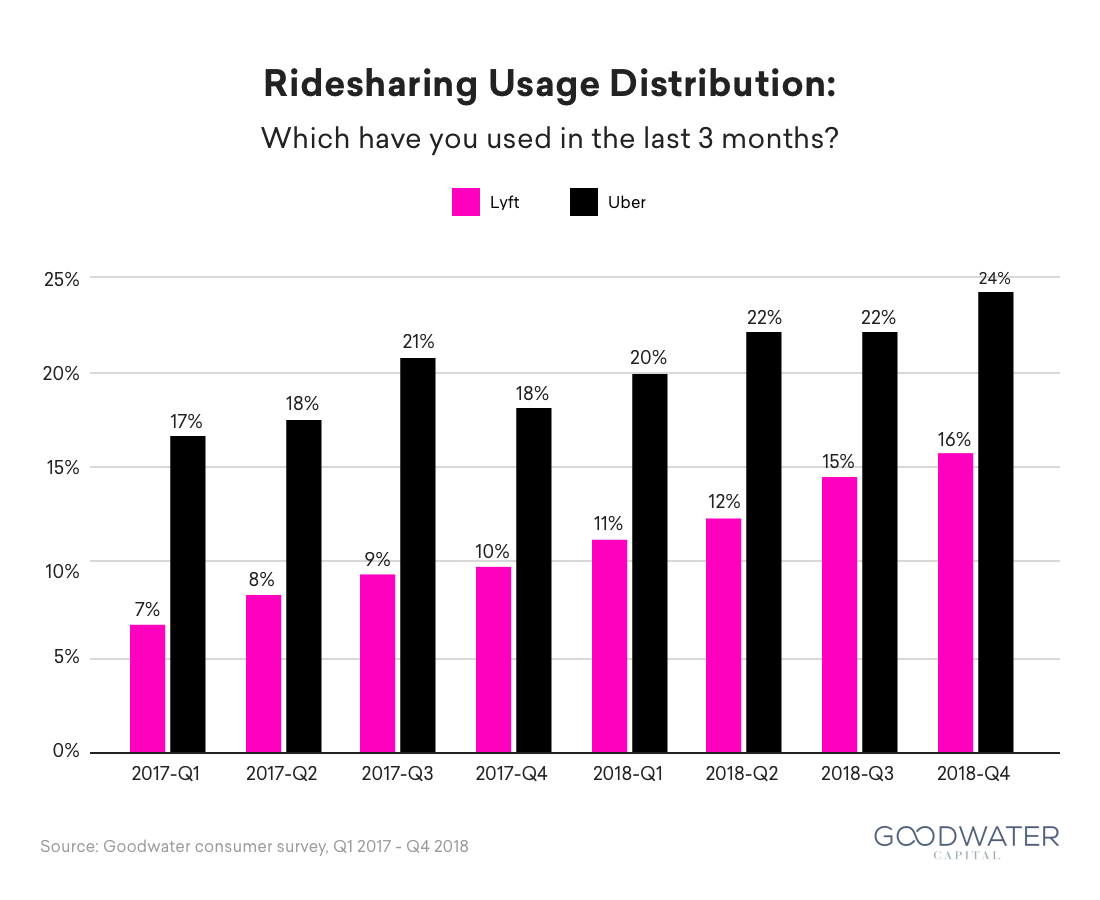
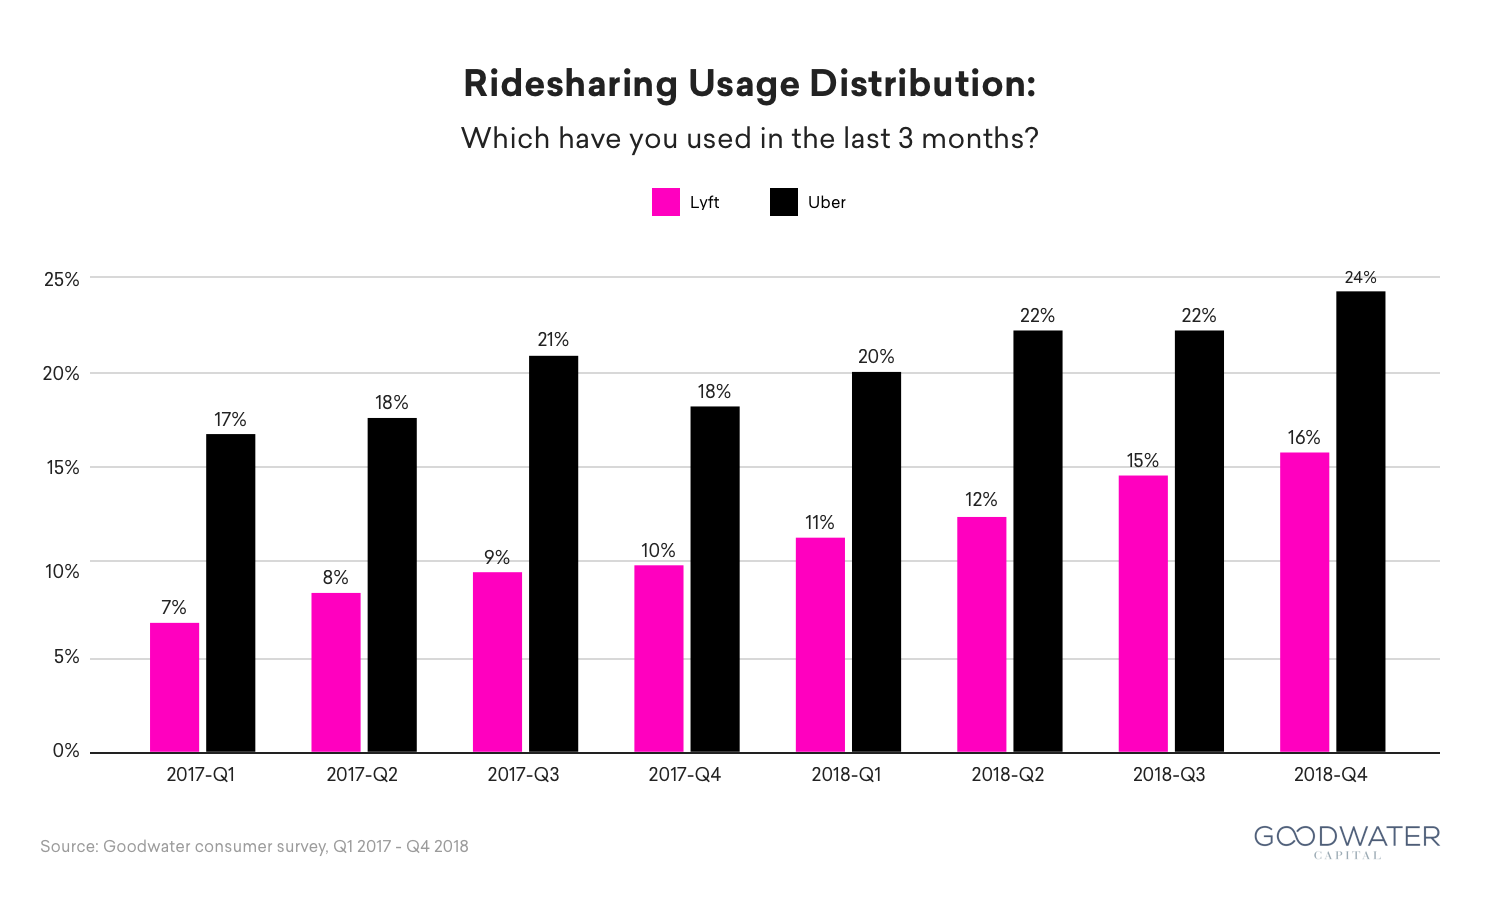
Ridesharing services on the rise. Ridesharing usage in the US has been increasing overall. In Q4 2018, 29% of respondents used a ridesharing service, up from 19% in Q4 2017, an increase of 52% YoY. While Uber has consistently demonstrated higher distribution, Lyft is growing almost twice as fast, from 10% in Q4 2017 to 16% in Q4 2018, at a rate of 60% YoY compared to Uber’s 33%.
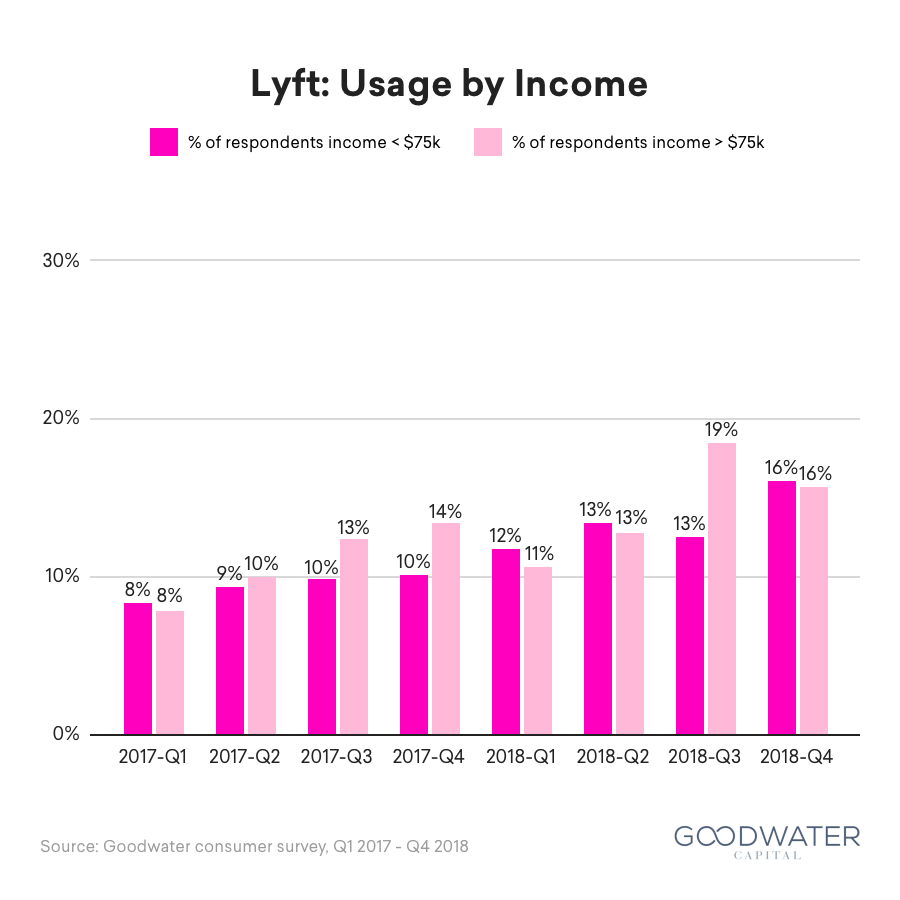
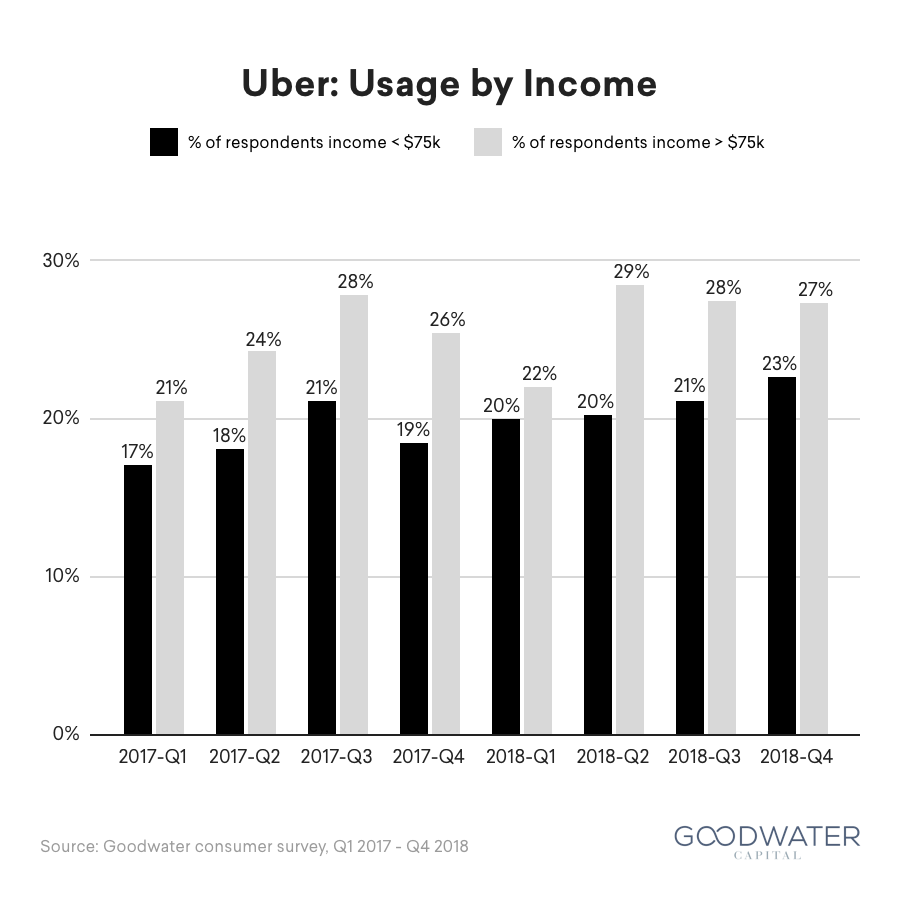
Rideshare user demographics. Both Lyft and Uber have highest usage penetration in the Pacific and Middle Atlantic regions, with Lyft users skewing younger than those of Uber. While Lyft user demographics are income balanced, Uber is used more frequently by high income users. In Q4 2018, 27% of respondents who used Uber had a household income of over $75,000, compared to 16% of respondents who used Lyft.
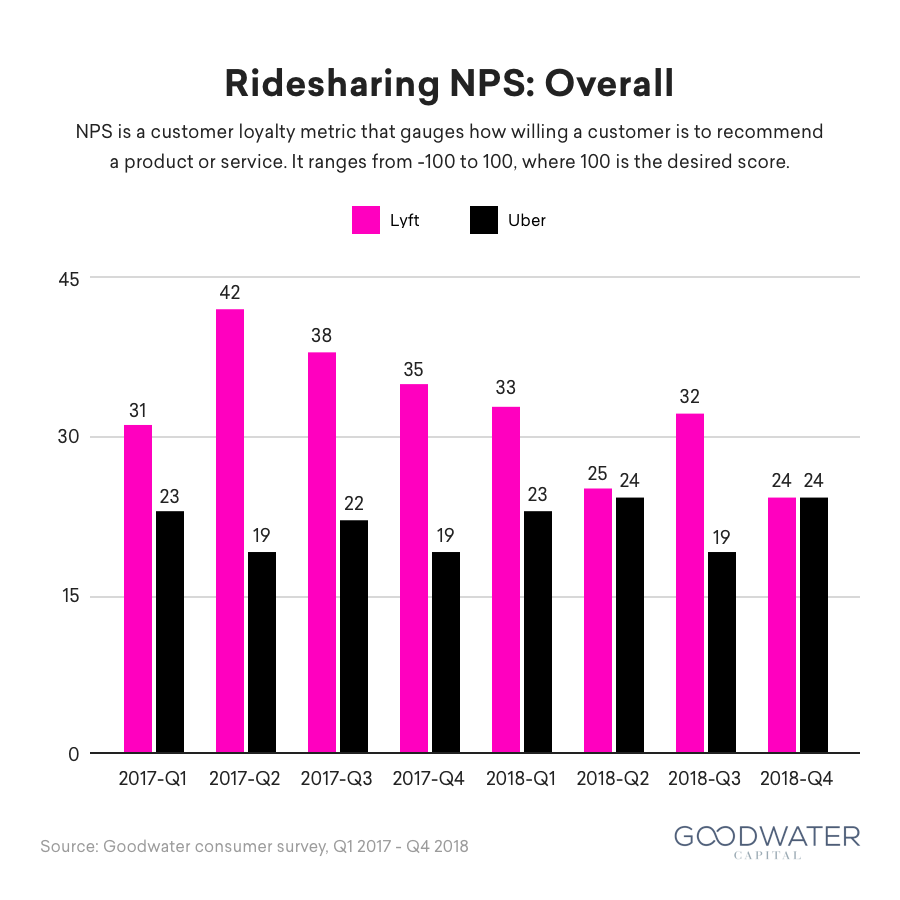
Customer love. While Lyft has generally enjoyed higher user satisfaction than Uber, recently Lyft’s Net Promoter Score (NPS) has been dropping. Lyft’s NPS peaked in Q2 2017 at 42, 23 points higher than Uber’s NPS at the time. However, Lyft’s lead in NPS has since declined, with users reporting an NPS of 24 for both Lyft and Uber in Q4 2018.
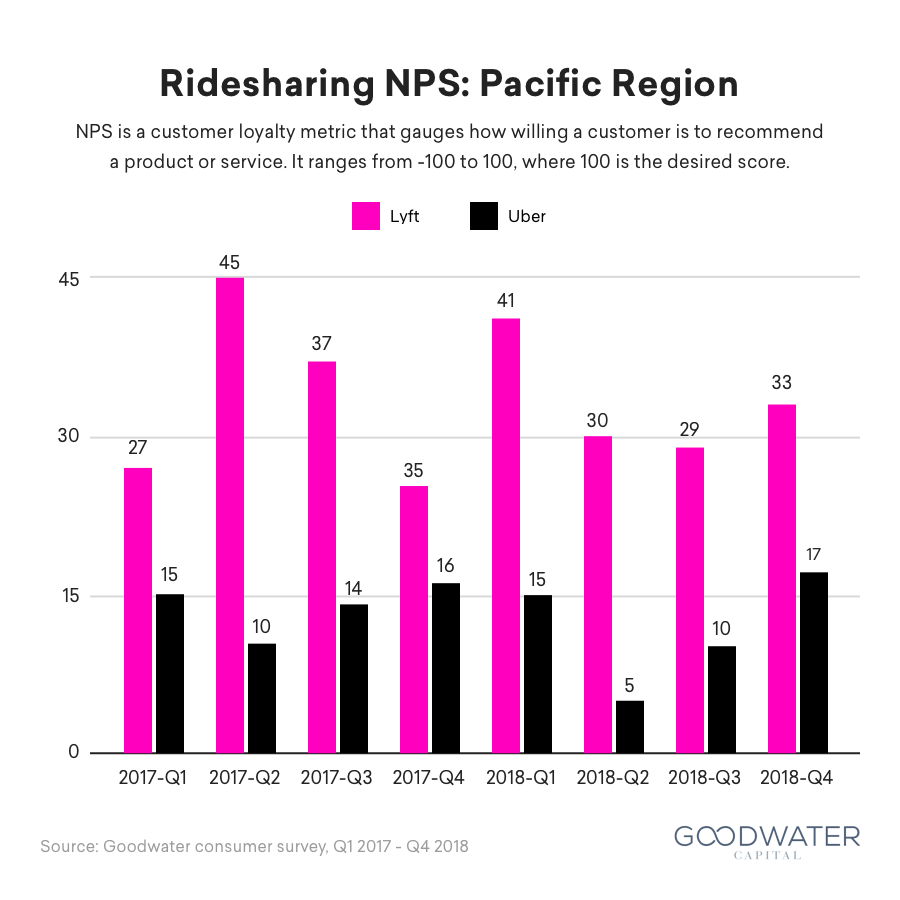
While customer love for Lyft and Uber are the same for the overall population, respondents in the Pacific region buck the trend, and strongly favor Lyft over Uber. Respondents in the Pacific region may have been influenced by the echo-chamber effect of Silicon Valley or the liberal-leaning socio-political environment.
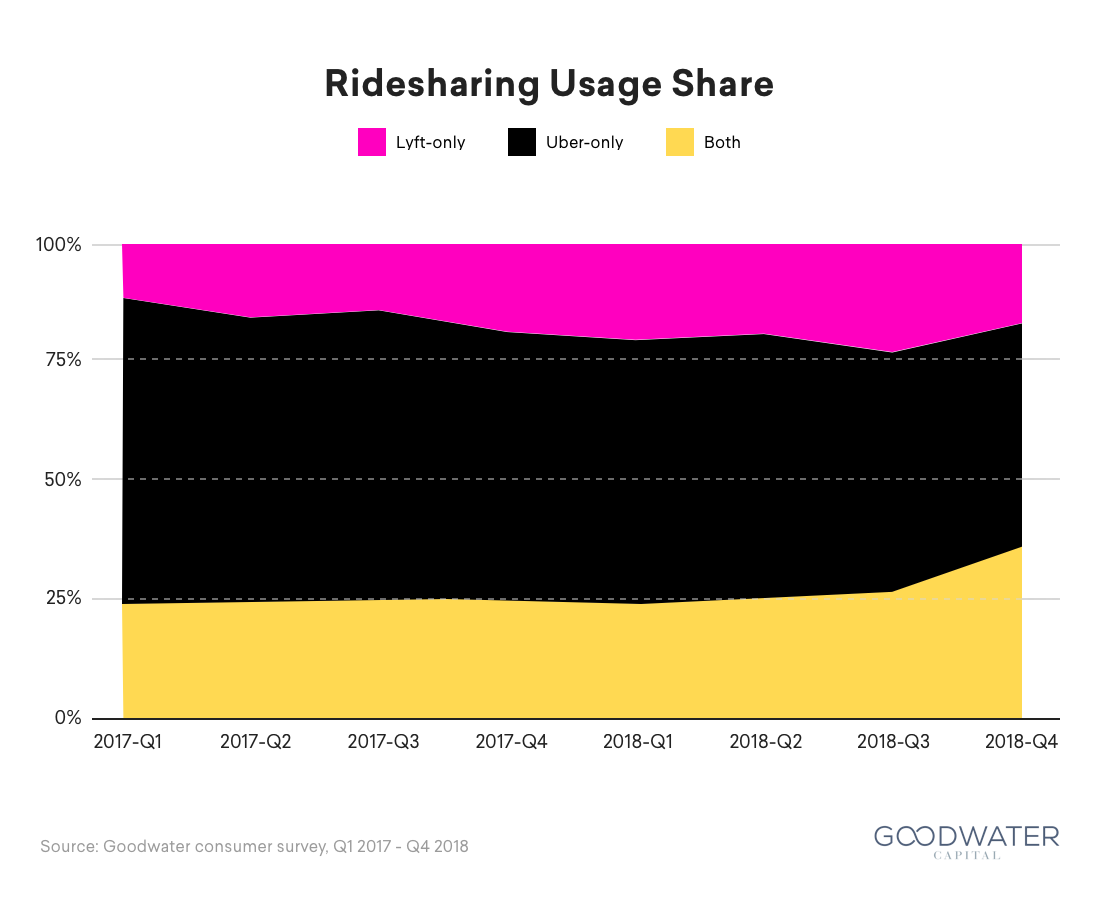
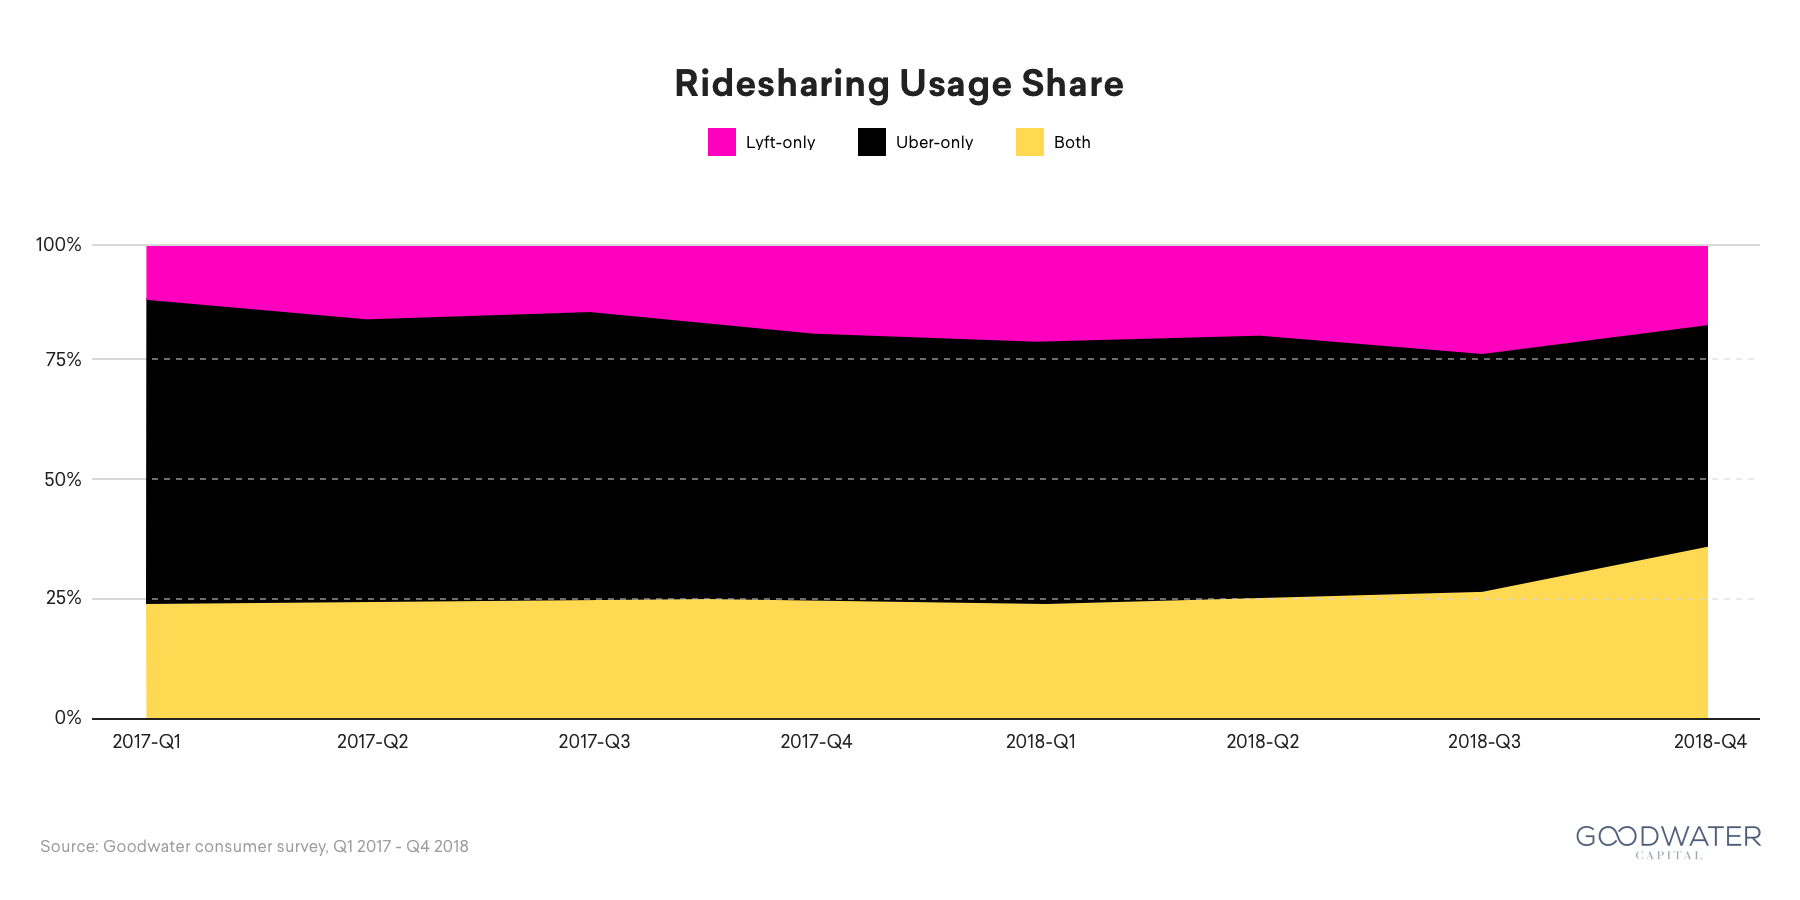
Growing prevalence of dual-app users. Consumers are also increasingly enjoying the use of both apps. Our survey usage data indicates that the percentage of users who use both Lyft and Uber is rapidly increasing, from 24% in Q1 2017 to 36% in Q4 2018. While customer love among dual-app users is significantly higher for Lyft, they transact more frequently on Uber.
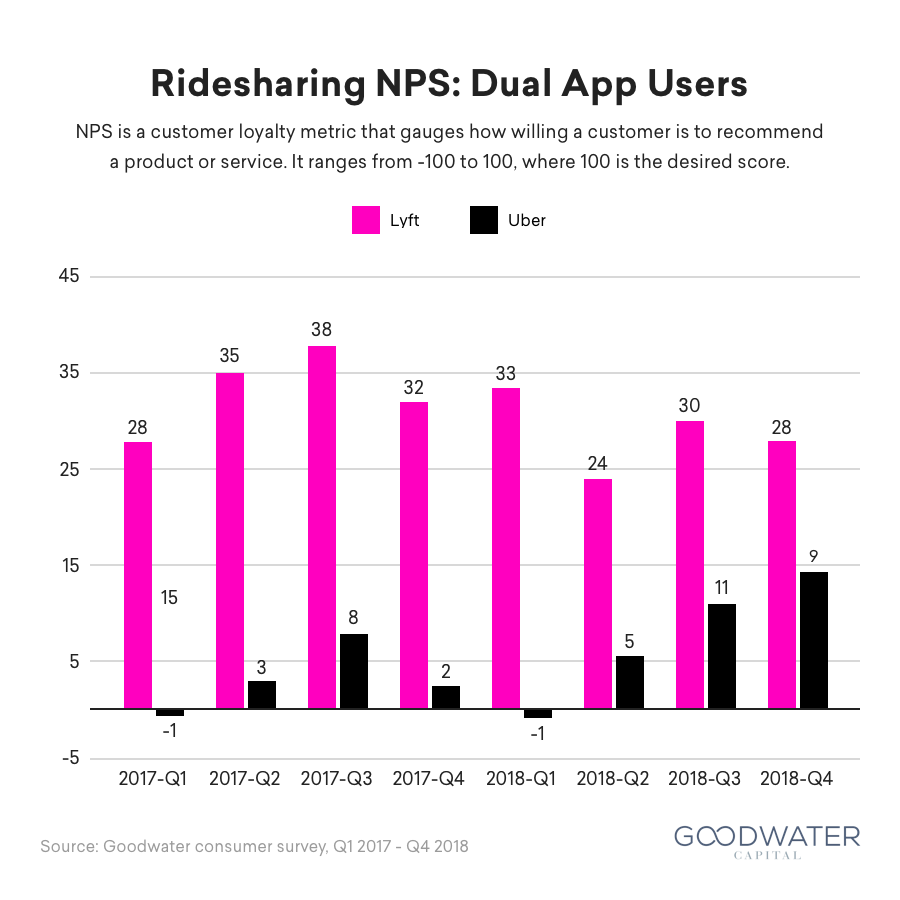
![]()
Market Landscape
Transportation is a massive opportunity. The transportation market in America and Canada represents a huge segment of consumer spending. In the United States alone, consumer expenditures on transportation were approximately $1.2 trillion in 2017. US households spend more on transportation than on anything else, with the exception of housing.22
However, car ownership is a very inefficient means of spending those transportation dollars. Cars as a mode transportation are underutilized and inefficient; they are only in use 5% of the time, and 89% of car trips to a place of work transport only one person.23 Cars are also inherently unequal; only certain families and individuals can afford to own a car, as the average cost of a new vehicle has increased to over $33,000.24
Positive trends for ridesharing. The US ridesharing market is on an upswing, bolstered by a population that is more receptive to sharing services than ever. A 2016 survey revealed that American respondents said “well-priced and convenient offerings could cause them to give up ownership altogether.”25 This trend is good news for Lyft, which grew its US ridesharing market share to 39% in December 2018, up from 22% in 2016.26 Several consumer technology trends have enabled the rise of ridesharing:
- Rise of on-demand services. Younger generations who are digitally savvy and more accustomed to instant gratification fuel the rise of on-demand services.
- Affinity toward mission-driven brands. Brands that value social responsibility and community engagement are appealing to the same youthful demographic.
- Increasing demand for flexible work opportunities. More workers are expecting jobs that cater to their needs and unique schedule.
Competitive landscape. The US on-demand transportation market can be divided into four different categories: ridesharing, scooters, bikes and peer-to-peer (P2P) carsharing.
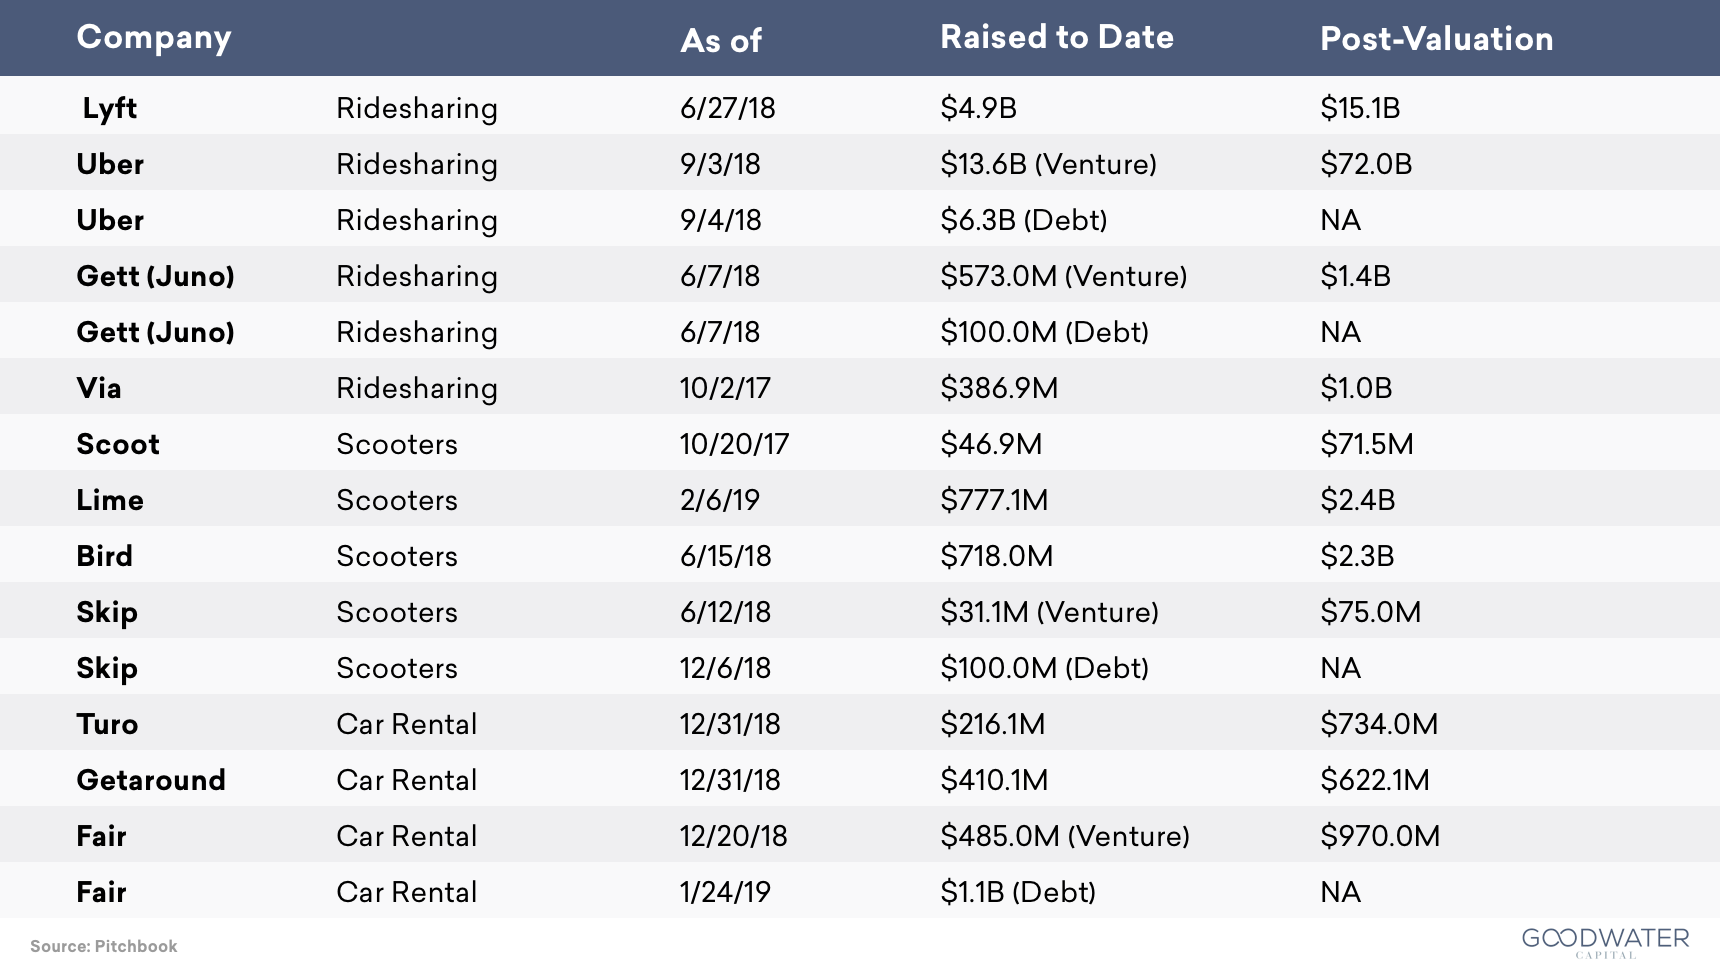
- Ridesharing. Uber and Lyft are the leaders in the US market. Via only operates in Chicago, Washington DC and New York City, while Gett acquired Juno in an attempt to break into the US market, but currently only operates in New York and New Jersey.
- Scooters. Currently 35% of vehicle trips are 2 miles or less,27 suggesting that there is a market for quick, on-demand transport options for short distances. Scooter sharing companies have stepped in to try to fill this void, with Bird and Lime leading in terms of overall coverage.28 Despite their dominance, they, along with competitors Lyft and JUMP (acquired by Uber) were recently denied a permit to operate in San Francisco, leaving only Skip and Scoot to compete in that market. The decision was a reminder that scooter services are being heavily regulated in many cities as community leaders attempt to evaluate how scooters fit into the network of existing transportation options.
- Bikes. While bikes have seen success in markets around the world, they are struggling in the US.29 Spin no longer offers bikes, and pulled out of its founding city Seattle. Lime and JUMP (acquired by Uber) still offer bikes in certain markets, but Lime advises that it is starting to phase out bikes and focus on scooters.30 Mobike, Ofo, and Pace (formerly Zagster) are also downsizing operations in the US and are pulling out of some cities completely.31 32 33
- Other land mobility. P2P car sharing – where an individual can list their car when they aren’t using it, essentially putting it up for rent by other users – is the main segment in the space, which is dominated by Turo and Getaround. This option is good for consumers who value freedom and reliability, but don’t want to use a traditional car rental service which can often be prohibitively expensive. Fair provides a slightly different spin, instead opting to partner with car dealerships who wish to lend out their vehicles.
Financial Overview
Achieving high growth at scale. Lyft primarily generates revenue through its ride-sharing marketplace by matching travelers and drivers, and facilitating the rider’s payment for the driver’s transportation services on Lyft’s mobile app. Lyft facilitated 619 million rides in 2018 and generated $8.1 billion in bookings, growing at 76% YoY. Lyft’s marketplace currently charges a 27% take rate on its bookings, enabling Lyft to generate $2.2 billion in net revenue in 2018. Lyft’s revenue has grown at 103% YoY, faster than their bookings growth rate due to increasing their take rate over the past year. Lyft riders paid $13.01 per ride excluding pass-through fees like tolls and took 9.6 trips per quarter, generating $125.42 in bookings and $36.04 in net revenue per active rider in Q4 2018.
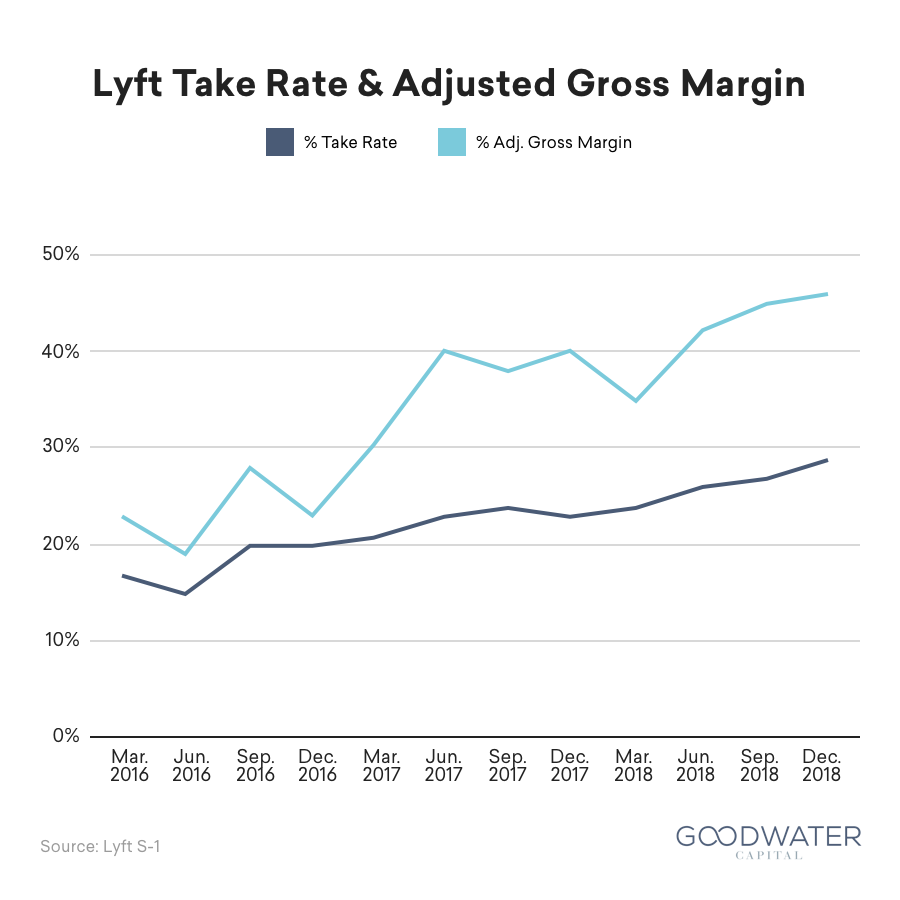
Leveraging network effects to improve margins. Every additional rider increases the value of the marketplace for drivers. More riders create more opportunity for drivers to match on an income-generating ride, maximizing their hourly income via increased efficiency. More drivers in turn attract more riders who can be matched with a ride more quickly. These network effects deliver more value to both drivers and riders, which enabled Lyft to increase its take rate from 16.8% in Q1 2016 to 28.7% in Q4 2018.
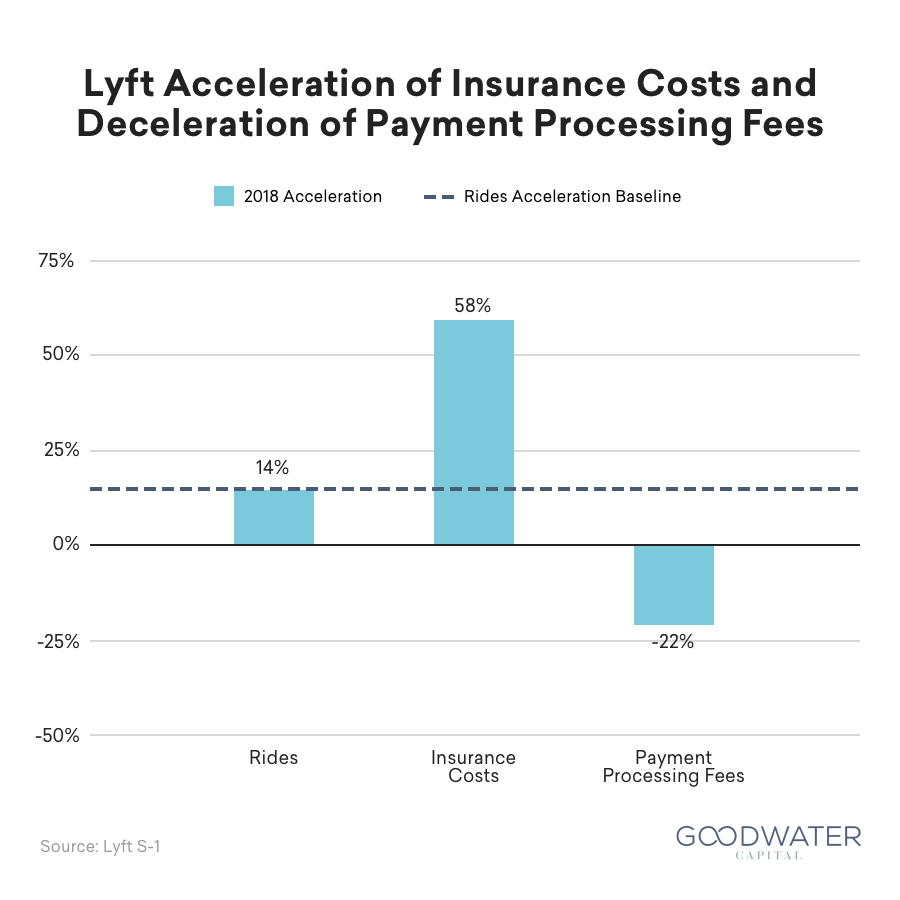
As Lyft’s network grows, the company should leverage economies of scale to lower payment processing fees, technology hosting, and insurance costs, resulting in improved gross margins. Lyft improved its adjusted gross margins from 24% in 2016 to 43% in 2018, primarily through increased take rates and decelerating payment processing fees. However, rising insurance costs have prevented further gross margin expansion, with insurance costs increasing by $201 million34 from 2016 to 2017 and $319 million35 from 2017 to 2018, an acceleration of 58%. In comparison, the number of rides grew by 213 million from 2016 to 2017 and by 244 million from 2017 to 2018, an acceleration of only 14%, and payment processing fees decelerated by 22% (increasing $140 million36 from 2016 to 2017 and $110 million37 from 2017 to 2018). Insurance appears to be one of the few cost levers that did not benefit from the size of Lyft’s network, with the losses paid per ride worsening from -$0.15 in 2016 to -$0.36 in 2018. This will likely be an area of continued focus for the company where better technology focusing on reducing insurance claims will have a large impact on Lyft’s margins.
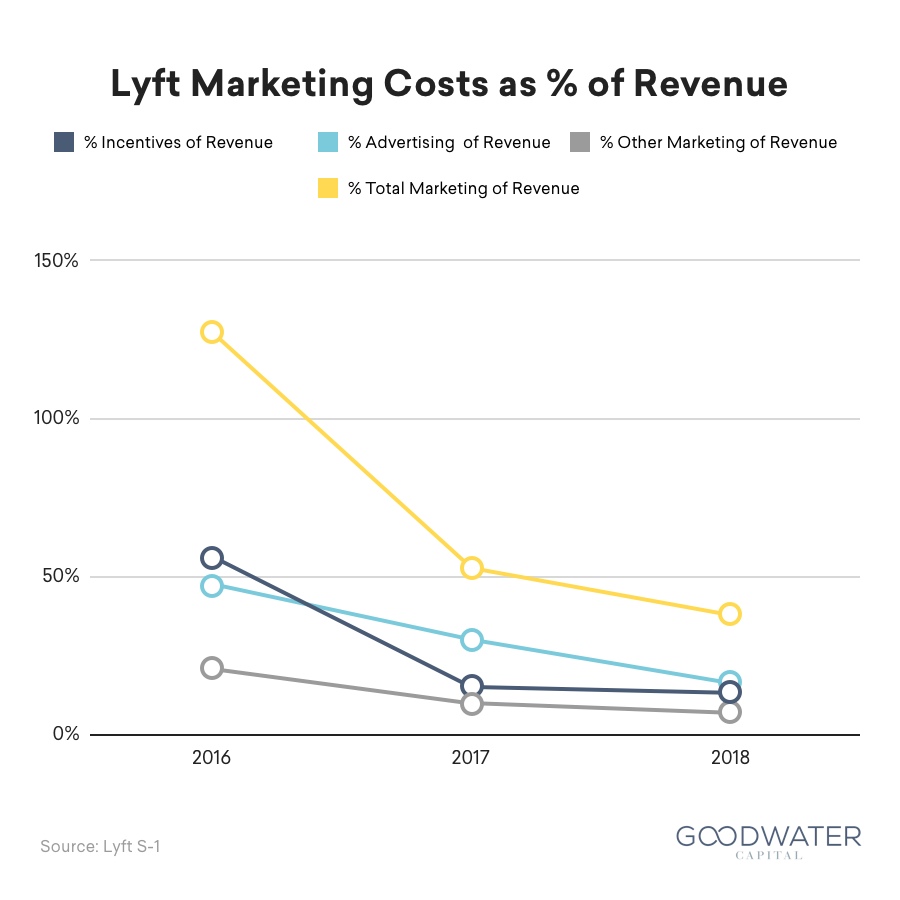
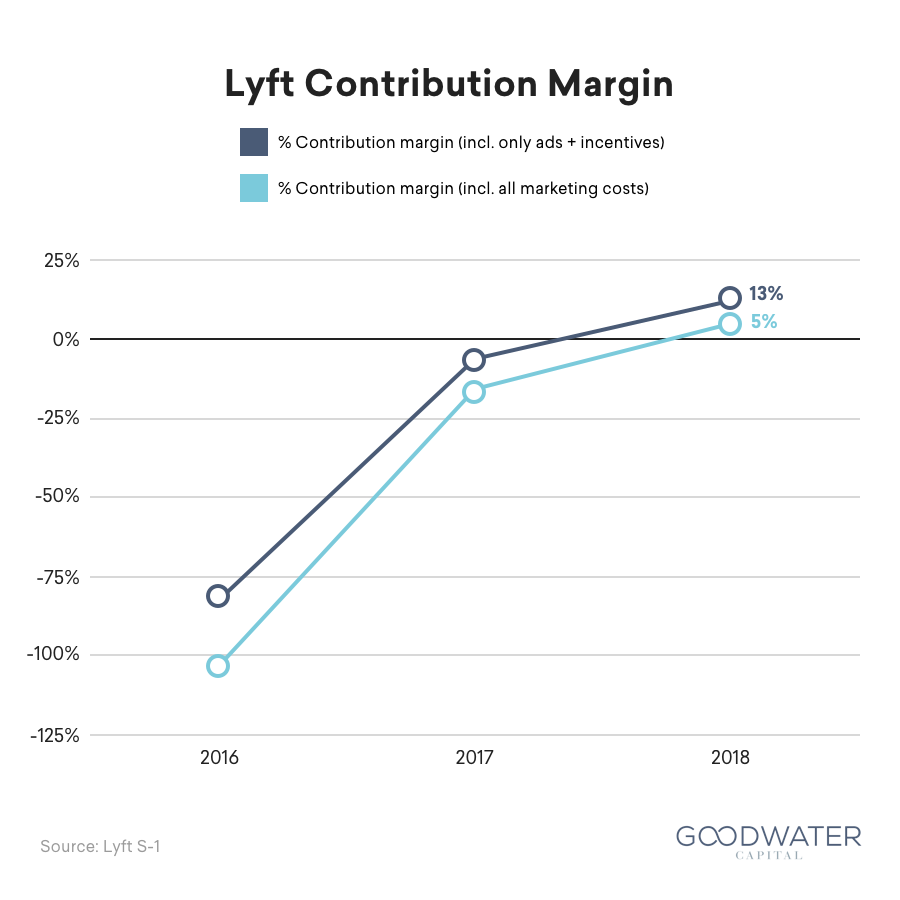
Balancing use of acquisition and retention marketing. To get to profitability, Lyft also needs to balance both new customer acquisition marketing and existing user retention marketing. Lyft’s sales and marketing costs were 37% of revenue, representing the difference in Lyft’s 43% adjusted gross margins and 5% contribution margin (including marketing costs) in 2018.
The company initially focused on new customer acquisition through the use of incentives, giving discounts and referral bonuses to drivers and riders, resulting in Lyft spending $196 million on incentives in 2016, greater than the $170 million it spent on paid advertising in the same year. However, in 2017, Lyft significantly decreased its incentive marketing spend from 57% of revenue to 15% of revenue with only a modest decrease in paid advertising to 30% of revenue. Lyft lowered these incentive marketing costs by decreasing the incentive marketing spend towards new customer acquisition and focusing incentive marketing more towards retention. The utilization of incentive marketing for loyalty resulted in the 2017 rider cohort taking 44%38 more rides the following year.
Paid advertising has remained Lyft’s most significant marketing channel today, totaling $352 million in 2018 and representing 44% of total marketing costs and 16% of revenue. While Lyft has continued to decrease paid advertising from 49% of revenue in 2016 to 16% in 2018, Lyft’s dependence on large advertising platforms remains significant, such as Google accounting for 26% of advertising spend in 2018.39 Success going forward will be dependent on the company’s ability to continue controlling marketing expenses and allocating effectively as they have done in previous years.
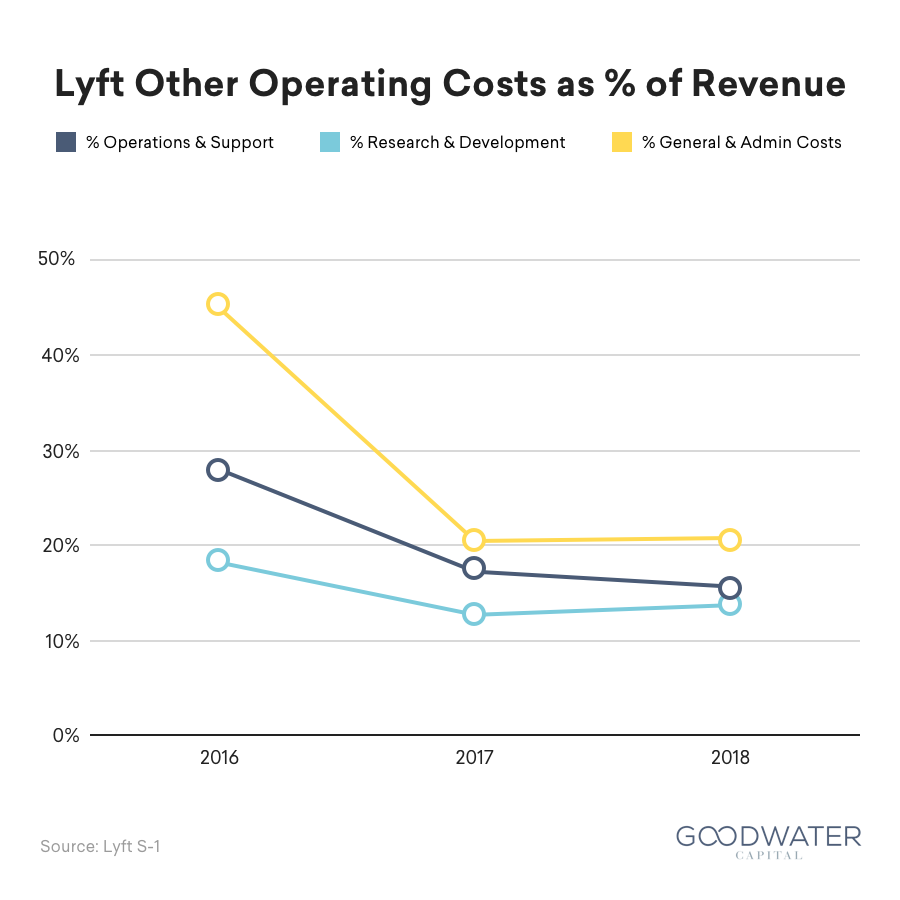
Exploring areas of operating leverage to achieve profitability. Lyft’s other operating costs include support, research and development (R&D), and general and administrative (G&A) costs. These costs in 2018 totaled to 50% of revenue, with G&A equal to 21% of revenue, followed by support equal to 16%, and finally R&D equal to 14%. In 2017, Lyft significantly improved its other operating expenses, going from 92% of revenue in 2016 to 50% in 2017. However, these costs remained at 50% of revenue in 2018, implying that their operating leverage has stagnated. These costs have left Lyft burning $911 million in EBITDA in 2018 with -44% EBITDA margin.
Executive Team
- Logan Green (CEO, Co-Founder, Director) was founder and CEO of Zimride, which became Lyft. He is currently a member on eBay’s board and was formerly a board member of the Santa Barbara Metropolitan Transit District. He graduated from UC Santa Barbara with a BA in Business Economics with an emphasis in Accounting.
- John Zimmer (President, Co-Founder, Vice Chairman) founded Lyft and Zimride with Logan Green. He has also worked as an Analyst at Lehman Brothers. John graduated from Cornell University with a BS in Hotel Administration.
- Ran Makavy (Executive Vice President and CPO) joined Lyft in March 2016 as the VP of Growth and was later promoted to Executive President and Chief Product Officer in December 2017. He was previously Director of Product Management at Facebook and was the founder and CEO of Snaptu, which was acquired by Facebook in 2011. He has a BA in Computer Science from The Open University and a MBA from the Australian Graduate School of Management.
- Jon McNeill (COO) has been Lyft’s COO since February 2018. Prior to this, he was the head of global sales at Tesla and co-founded several companies including TrueMotion, Trek Bicycle Stores and Enservio. Jon studied at Northwestern University.
- Brian Roberts (CFO) joined as Lyft’s CFO in October 2014. Before this, he was the SVP of Business Development and Strategy at Walmart eCommerce, Senior Managing Director at Evercore and VP of Corporate Development at Microsoft. Brian holds a MBA from Harvard and a BA in Economics from UC Berkeley.
- LYFT S-1, at page 6.
- LYFT S-1, at page 125.
- TechCrunch, https://techcrunch.com/2014/08/29/6000-words-about-a-pink-mustache/.
- Forbes, https://www.forbes.com/sites/simonmainwaring/2018/10/16/how-lyft-drives-growth-through-purpose/.
- TechCrunch, https://techcrunch.com/2014/11/30/lyft-quirks/.
- Recode, https://www.recode.net/2018/5/17/17360564/lyft-uber-younger-users.
- LYFT S-1, at page 5.
- Mashable, https://mashable.com/2017/03/14/delete-uber-lyft-1010data/#No_p5pg1Wiqw.
- LYFT S-1, at page 9.
- Harvard Business Review, https://hbr.org/2018/07/for-some-platforms-network-effects-are-no-match-for-local-know-how.
- LYFT S-1, at page 6.
- Reuters, https://www.reuters.com/article/us-lyft-ipo-filing/lyfts-ipo-filing-shows-surging-revenue-widening-losses-idUSKCN1QI51K.
- Adjusted gross margins are equivalent to Lyft’s S-1 contribution margin defined as revenue less cost of revenue, adjusted to exclude the following items from cost of revenue: amortization of intangible assets, stock-based compensation, and changes to insurance reserves.
- LYFT S-1, at page 85.
- LYFT S-1, at page 2.
- TechCrunch, https://techcrunch.com/2018/09/06/lyft-launches-its-scooter-business-in-denver/.
- LYFT S-1, at page F-23.
- LYFT S-1, at page 7.
- LYFT S-1, at page 132.
- Excludes age under 18.
- Q1 2017 – Q1 2018 sample size: 3,000. Q2 2018 – Q4 2018 sample size: 1,500.
- LYFT S-1, at page 1.
- LYFT S-1, at page 4.
- LYFT S-1, at page 4.
- LYFT S-1, at page 5.
- LYFT S-1, at page 125.
- National Household Travel Survey Our Nation’s Travel, https://nhts.ornl.gov/vehicle-trips.
- TechCrunch, https://techcrunch.com/2018/12/23/the-electric-scooter-wars-of-2018/.
- National Association of City Transportation Officials, https://nacto.org/bike-share-statistics-2017/.
- SF Chronicle, https://www.sfchronicle.com/business/article/Lime-dropped-the-bike-from-its-name-now-13621057.php.
- Tech In Asia, https://www.techinasia.com/china-bike-sharing-startups-pulling-out-overseas-cities.
- CNN, https://money.cnn.com/2018/07/19/technology/ofo-bike-share-us/index.html.
- Curbed, https://ny.curbed.com/2018/9/27/17911346/nyc-dockless-bike-share-pilot-rockaways-pace-bikes.
- LYFT S-1, at page 95.
- LYFT S-1, at page 96.
- LYFT S-1, at page 95.
- LYFT S-1, at page 96.
- LYFT S-1, at page 82.
- Assumes that all costs paid to Alphabet are for Google advertising.