


Goodwater Thesis
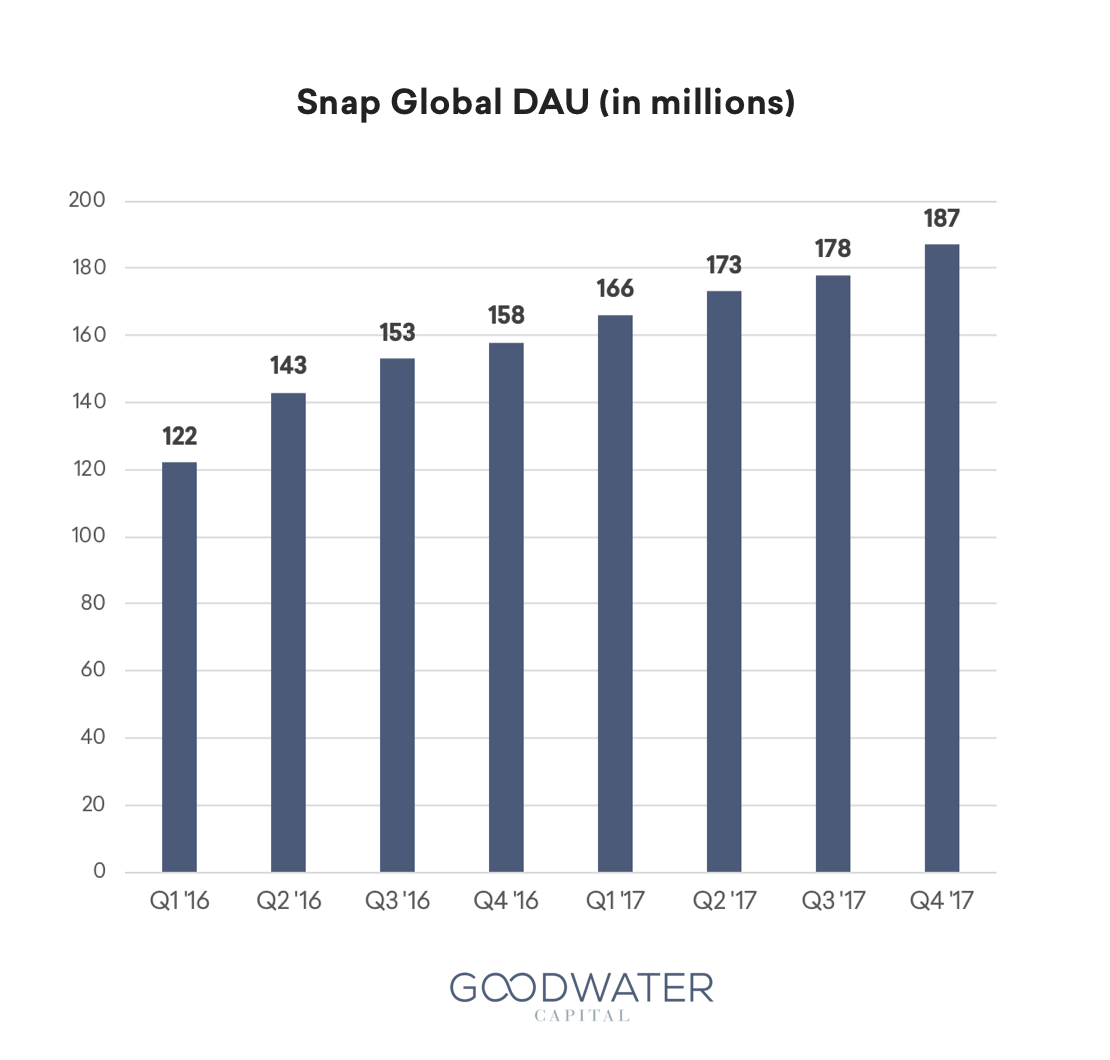
In February 2017, we launched our first Thesis report with an in-depth overview of Snap’s business immediately prior to its IPO. From Q4 2016 to Q4 2017, DAUs have grown by 18% to 187 million1, and revenue has increased 72% from $166 million to $286 million2. Snap’s audience remains dominated by users under 30 years old. While Snap faces formidable competition within social media, the company continues to lead in product innovation, placing several large bets in AR, discovery and content to drive engagement and expand its audience. This Thesis update provides our consumer research findings over the last year, company performance highlights and comparative post-IPO performance of the leading social media networks.
Year in Review: Key Metrics & Product Roadmap
- Improved user growth. DAUs increased 18% from 158 million in Q4 2016 to 187 million in Q4 2017. Significant increases in new Android users as a percentage of net additional users along with a 20% increase in Android user retention were key drivers of user growth. With 43% of their DAUs in North America3, Snap continues to seek growth primarily from international expansion and older users.
- Impressive revenue performance. Q4 revenue of $286 million increased 72% year-over-year and 37% quarter-over-quarter4. International represented 23% of total revenue in Q4 compared to only 12% y-o-y. Revenues for the year more than doubled, up 104%.
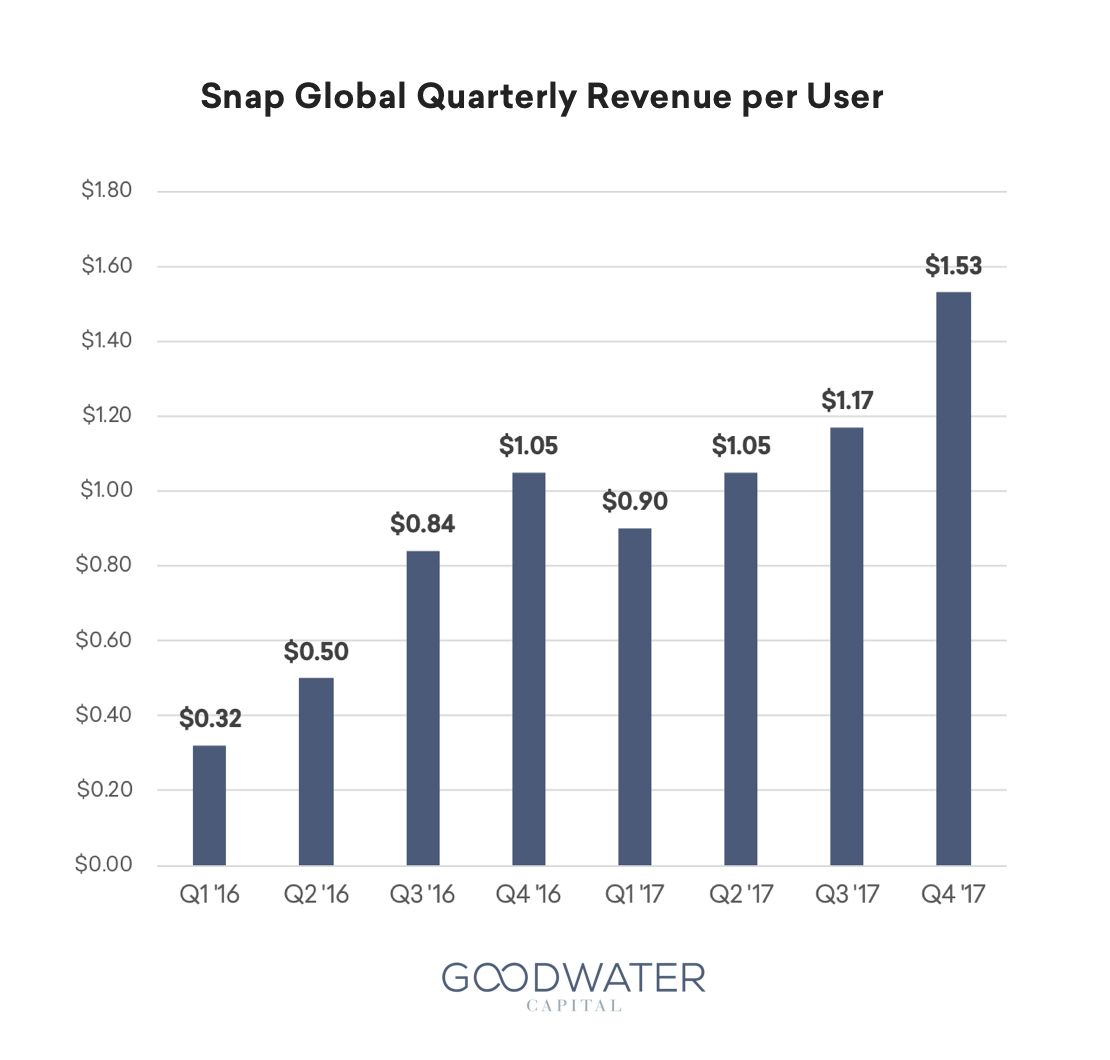
- Increased monetization while maintaining flat to increasing NPS. ARPU increased 47% y-o-y from $1.05 in Q4 2016 to $1.53 in Q4 20175, with North America ARPU bringing in significantly more than Rest of World. Snap’s investment in automated ad buying paid off with over 90% of Snap ad impressions delivered programmatically, up from 10% in Q4 2016. Effective cost per ad impression decreased by 25% sequentially in Q4.
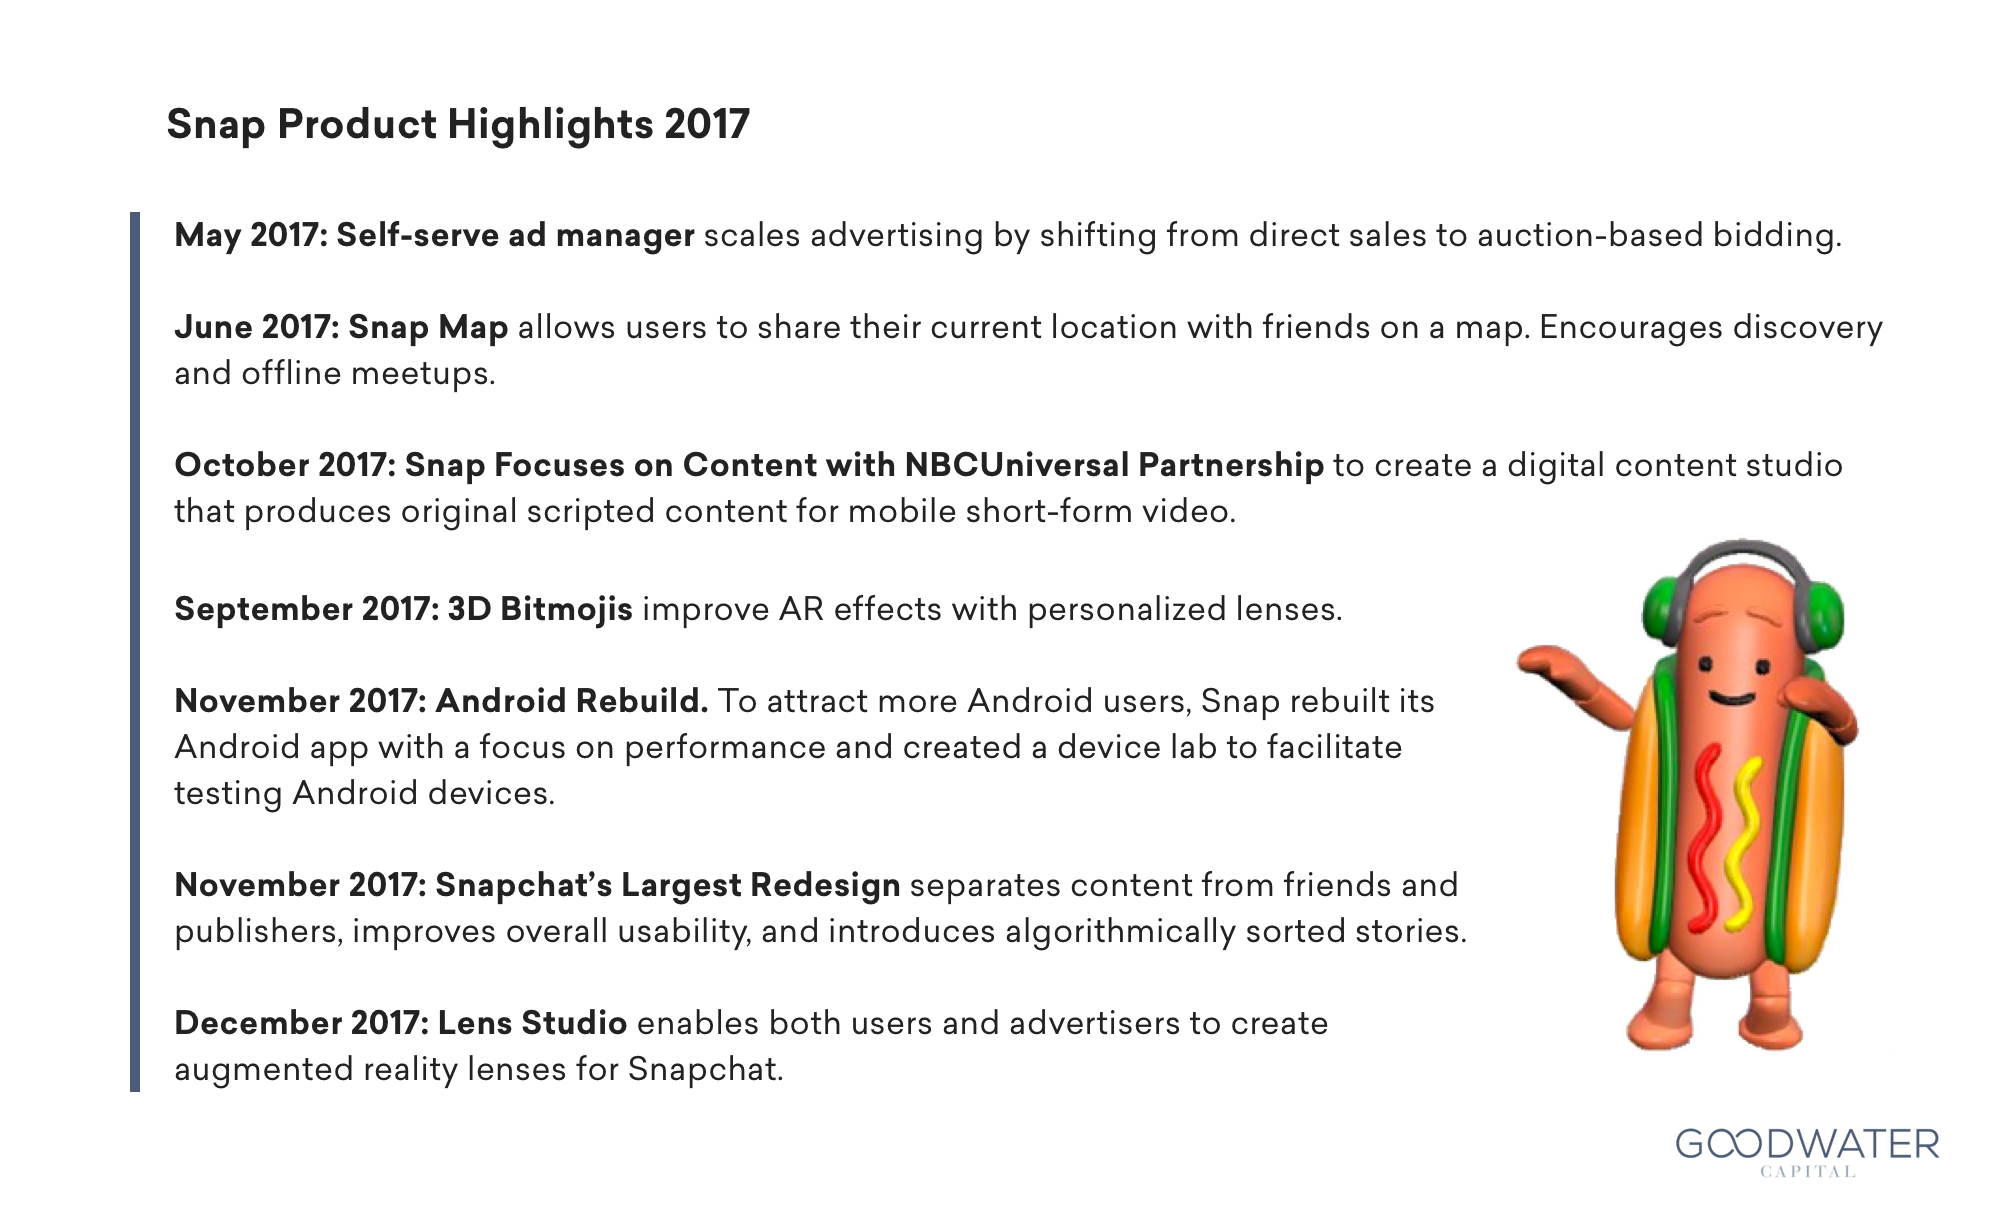
- Strong product execution. Snap is an impressive product innovator, pioneering and catalyzing the mainstream adoption of vertical video, ephemeral messaging, and augmented reality. In 2017, Snap prioritized performance, quality, and automation6, while continuing to drive growth, engagement, and differentiation from its competition.
Usage Trends: Goodwater Consumer Survey
Every quarter we conduct a 3,000-person consumer survey across a representative panel of consumers representing all ages, demographics and geographies of the US. Survey respondents reported on their usage across a broad range of consumer technology products throughout 2017.
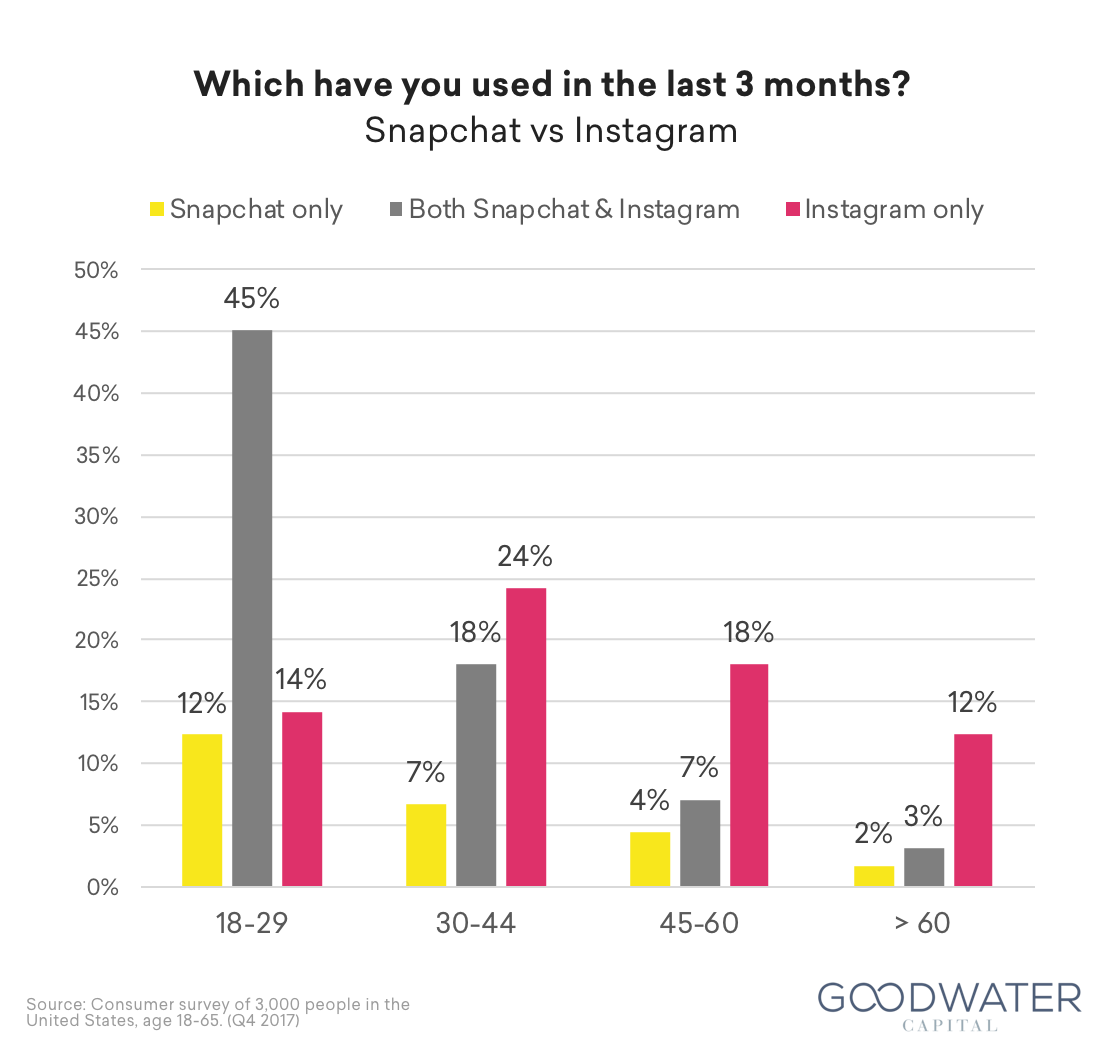
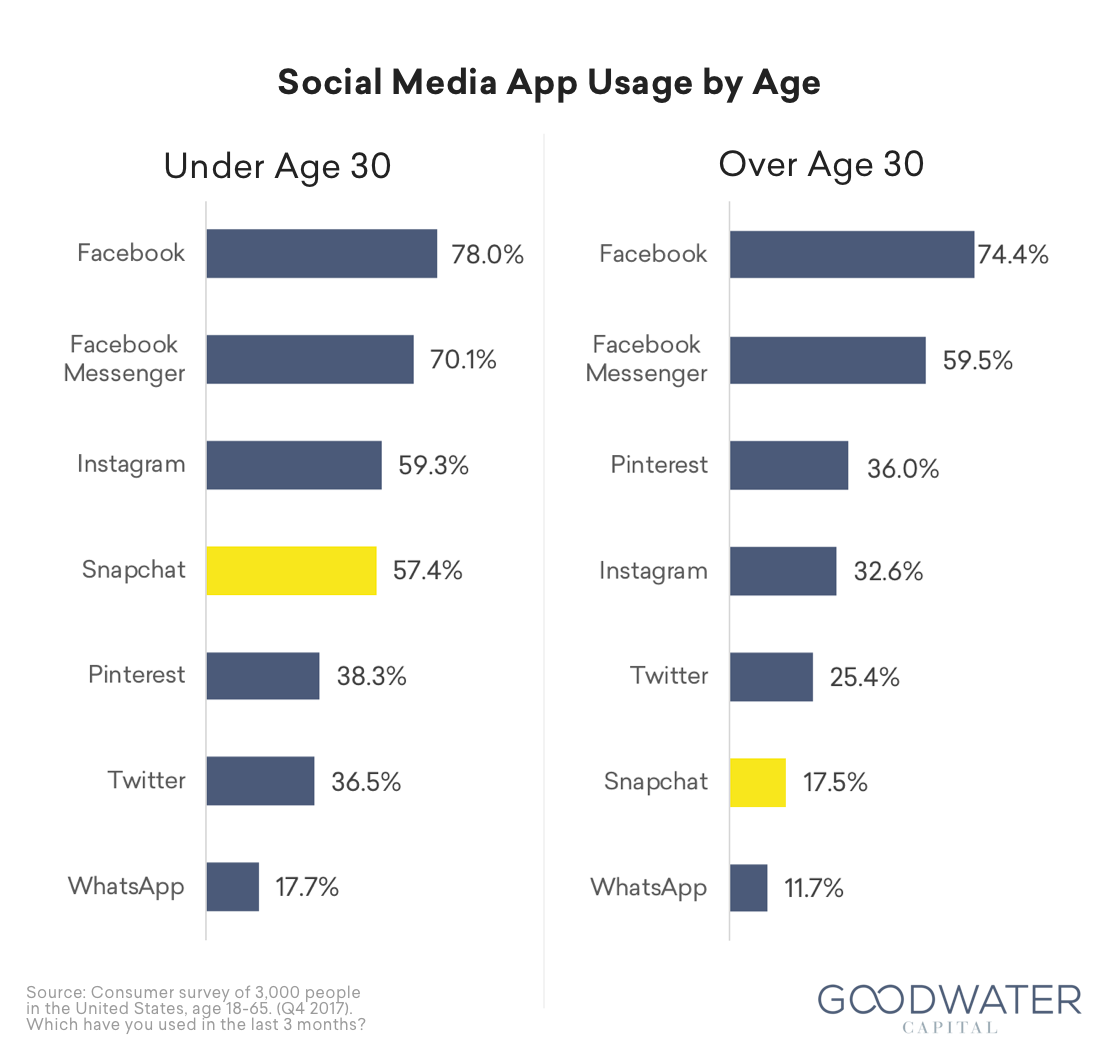
- Snap continues to seek expansion into older demographic. One of Snap’s key strategies to drive growth is expanding into older demographics, in which it primarily competes with Instagram. Almost half of respondents under 30 years old use both Snapchat and Instagram, but Instagram has an increasingly dominant presence as users age.
- Strong presence amongst hard-to-reach audience segments. 57% of respondents under 30 years old used Snapchat last quarter, compared to only 18% of respondents over 30. Snap has focused on expanding its user base to over 30, however Snap’s penetration among consumers over age 30 has remained largely unchanged (15% in Q1 v. 17% in Q4). While Snap is unique in its ability to reach coveted younger users, this may also impact Snap’s expected revenue growth as advertisers compare performance across platforms with more mature monetizable audiences.
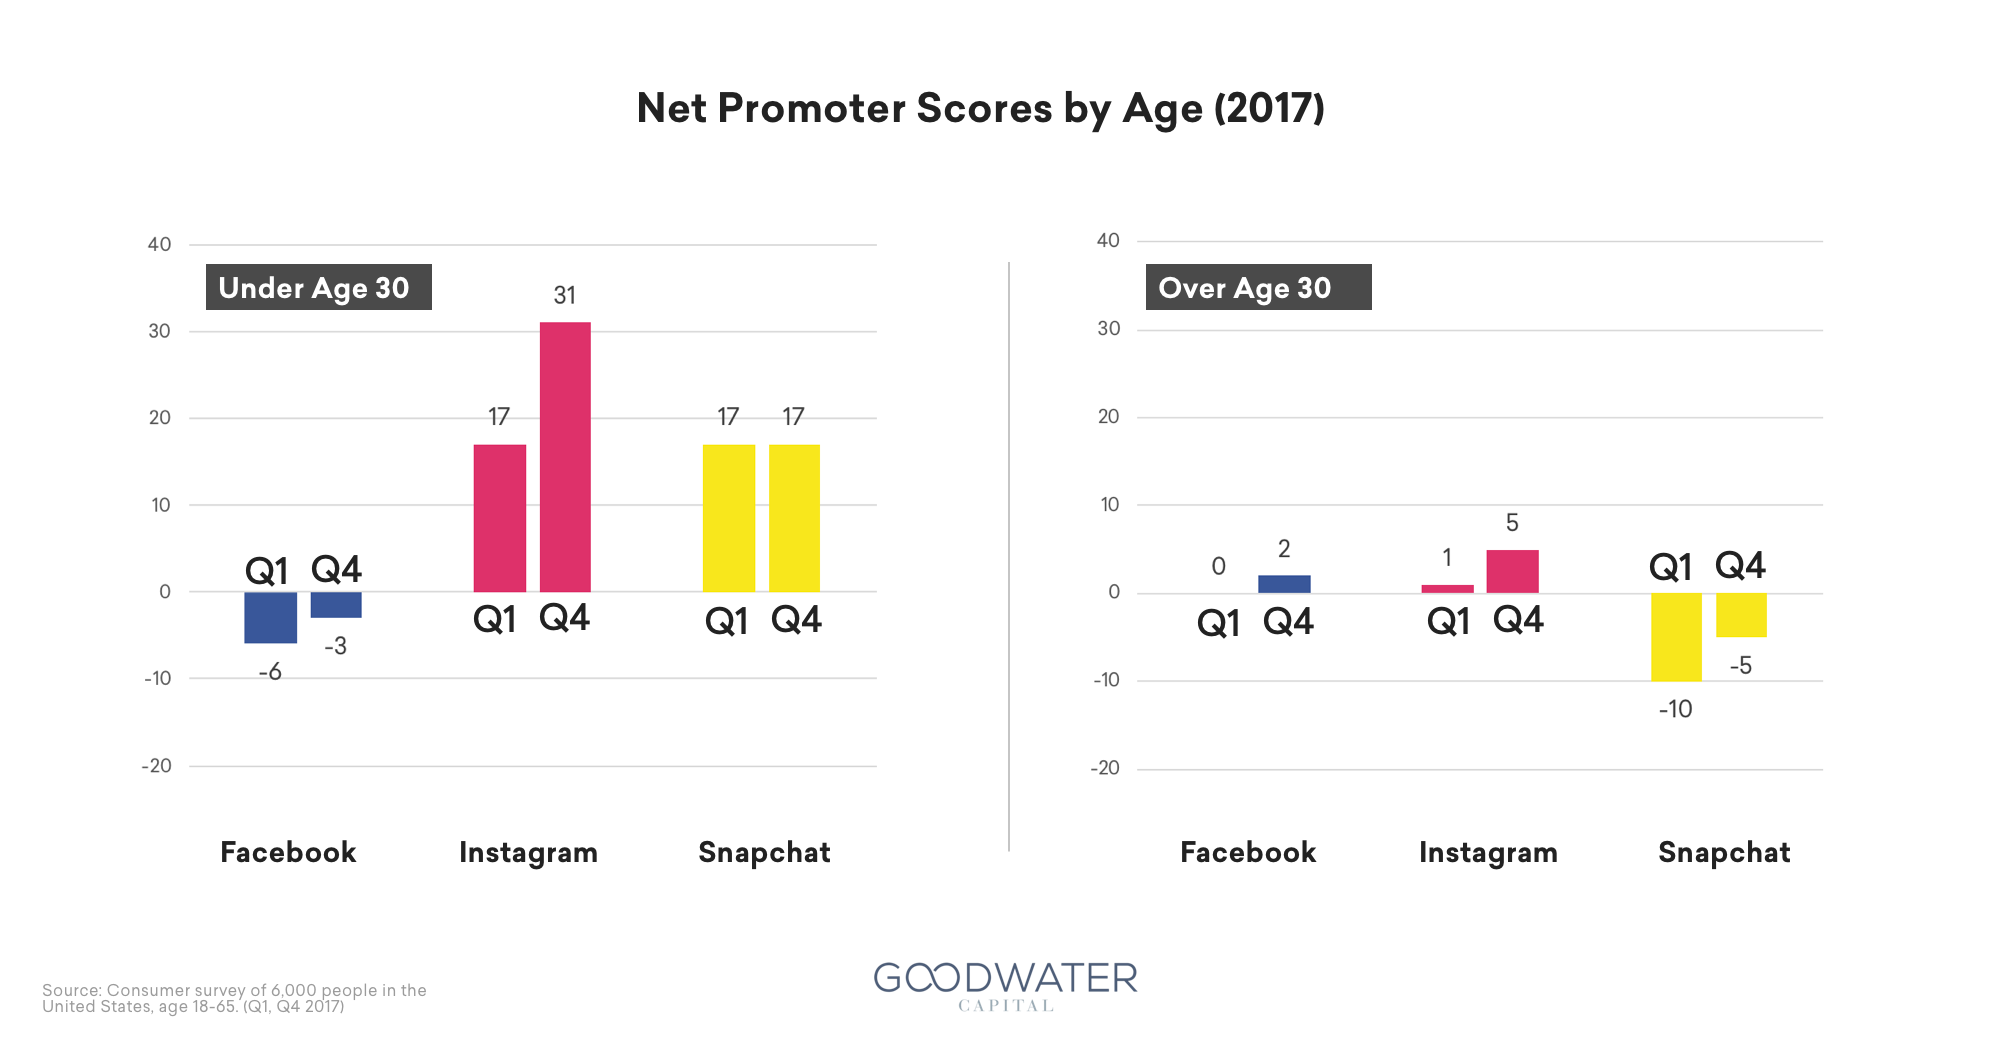
- Increased monetization while maintaining flat to increasing NPS. Snap NPS was flat from Q1 to Q4 for users under 30 years old, and improved to -5 NPS in Q4 for users over 30 years old. While Snap has improved NPS across users over 30, Instagram has experienced increasing NPS across both age groups, increasing from 17 to 31 from Q1 to Q4 for users under 30, and 1 to 5 over the same period for users over 30.
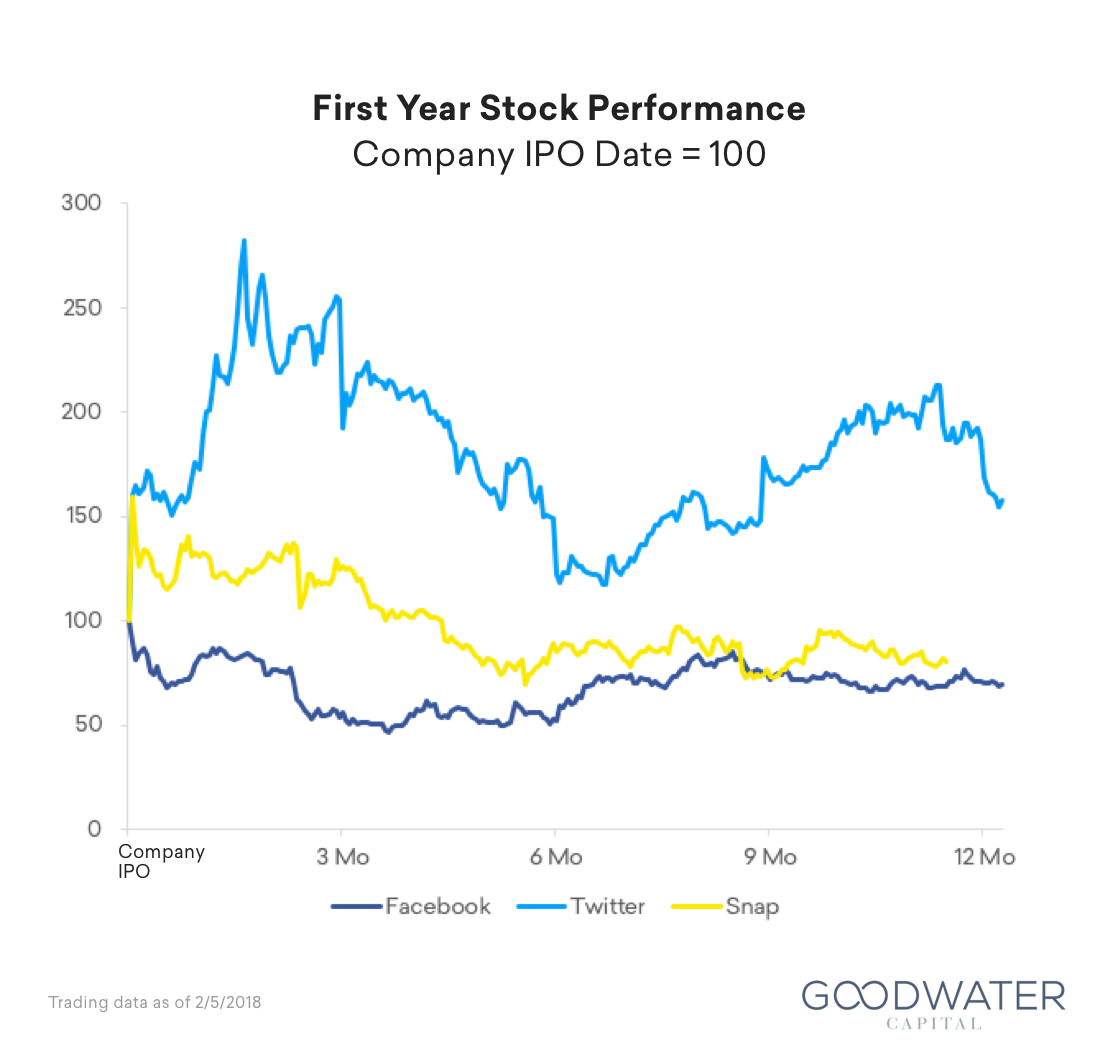
One Year Later…
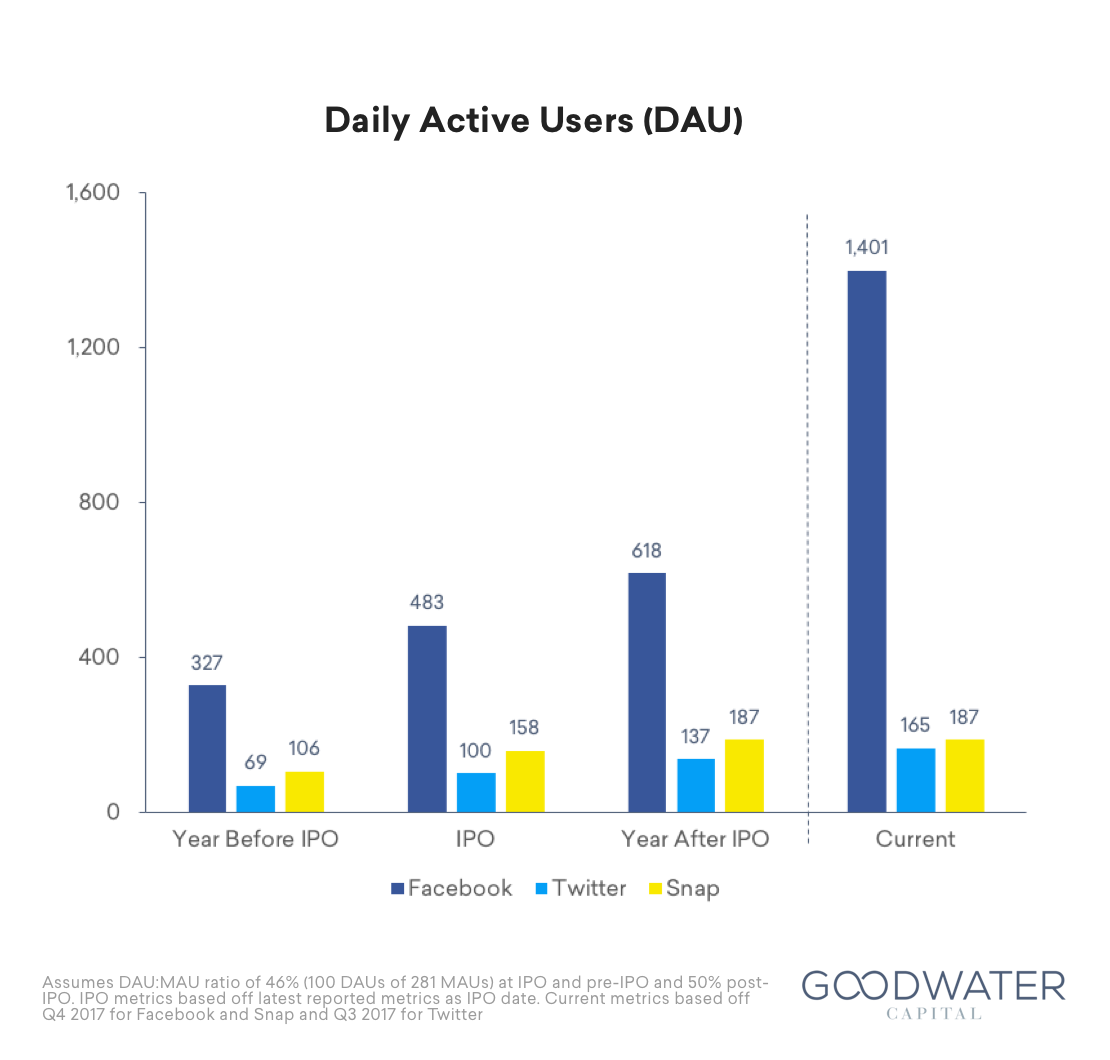
Snap’s DAU growth was slower relative to Facebook’s and Twitter’s growth one year following their IPOs. Given the slowdown in DAUs, the company indicated that the focus for 2018 would be on user growth, content, and augmented reality7. Snap has proven to develop features that drive higher engagement, which could accelerate ARPU growth.
- DAUs. SNAP’s DAUs increased by 18% one year after its IPO; Facebook’s and Twitter’s DAUs increased by 28% and 37%8, respectively, over the same one year period post-IPO.
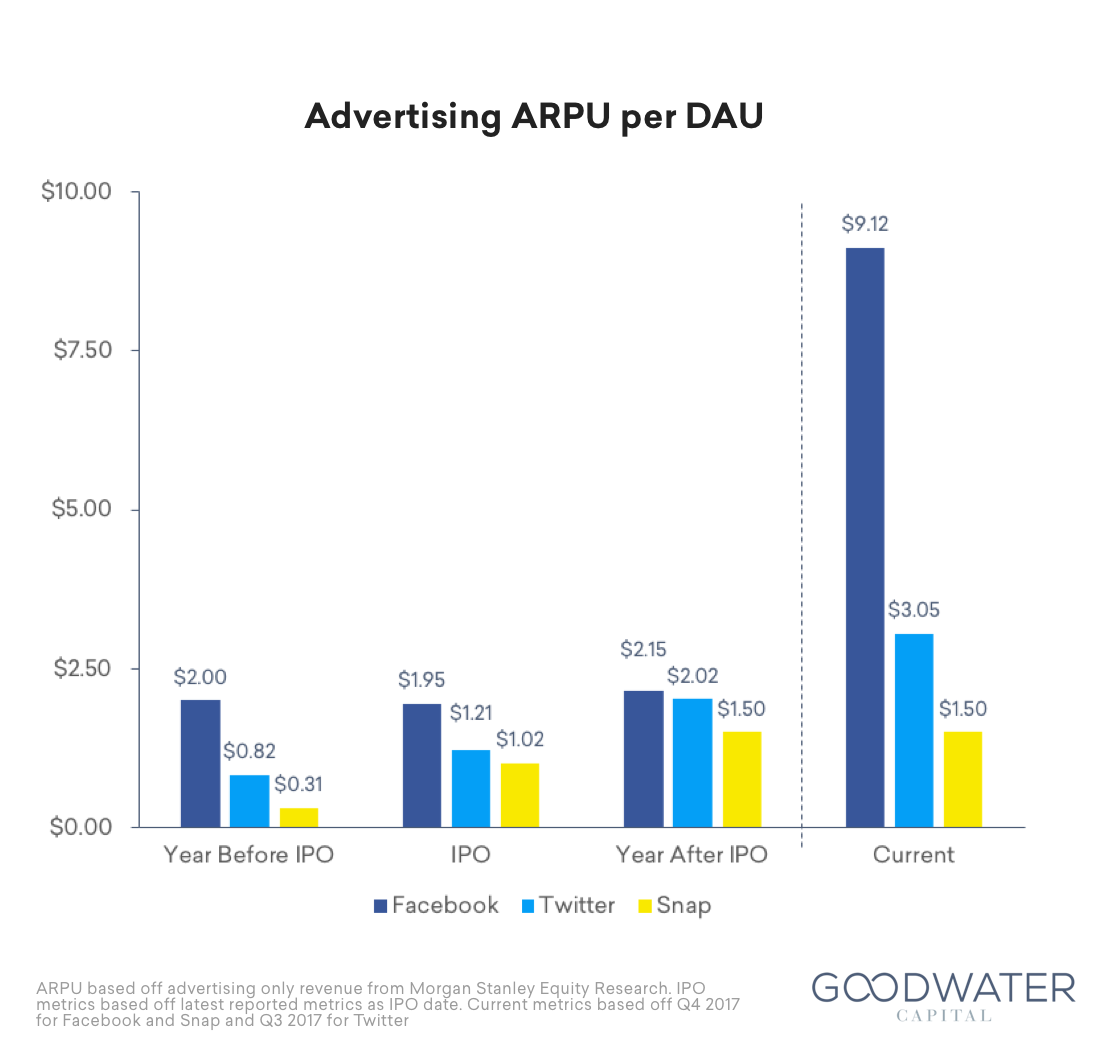
- ARPU. SNAP’s advertising ARPU increased by 48% to $1.50 as of Q4 2017 from $1.02 at IPO; over the same one year period post-IPO, Facebook’s advertising ARPU increased by 10% to $2.15 and Twitter’s ARPU increased by 67% to $2.029.
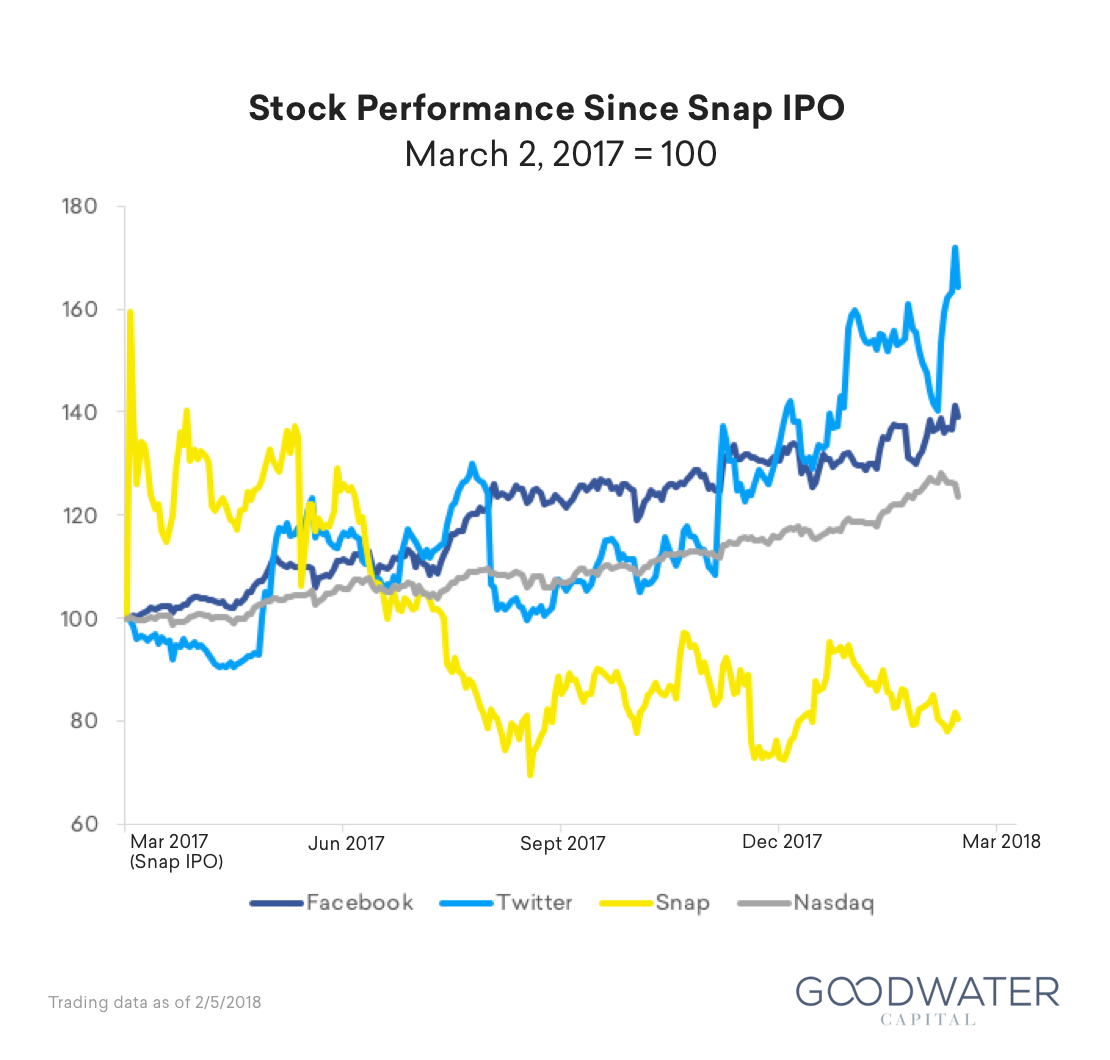
- Snap’s stock price is down 19%10 since IPO compared to Facebook’s 31% stock price decrease and Twitter’s 57% stock price increase one year after going public.
- SNAP Q4 and Full Year 2017 Earnings Report
- SNAP Q4 and Full Year 2017 Earnings Report
- SNAP Q4 and Full Year 2017 Earnings Report
- SNAP Q4 2017 Prepared Remarks
- SNAP Q4 2017 Prepared Remarks
- SNAP Q3 2017 Prepared Remarks
- SNAP Q3 2017 Prepared Remarks
- Facebook & Twitter Public Company Filings
- Advertising ARPU based off of advertising only revenue from Morgan Stanley Equity Research
- Trading data as of 2/5/2018