

While other retail players have ramped up competition for mainstream consumers with D2C brands and vertical marketplaces, Wish has carved out its own substantial market position by reaching underserved lower-income consumers. It's been that laser focus on connecting these consumers with merchants who can offer the lowest prices possible that has established Wish's reputation as a price leader and enabled the company to reach 100+ countries, 100M+ MAUs, and 500K+ merchants in the span of a decade.
Building a Marketplace for Underserved Consumers
On the surface, the concept of Wish sounds difficult to believe — goods with 80–90%+ discounts. It's easy to dismiss Wish as selling low-quality or counterfeit products.
But the reality on the ground is that while modern e-commerce has been largely built for the mass market, it has always tilted toward consumers who can afford a $129 Amazon Prime subscription, D2C carbon steel cookware, or $300+ Yeezys. It implicitly ignores the 45% of the US population with an income under $50K, where price is a large factor in the purchasing decision.
An interesting comparison is to overlay Wish's US penetration with income disparity as measured by the Gini coefficient — a measure of income or wealth inequality within a group of people. The states where Wish tends to do well are also the ones with higher inequality and more issues with affordability.
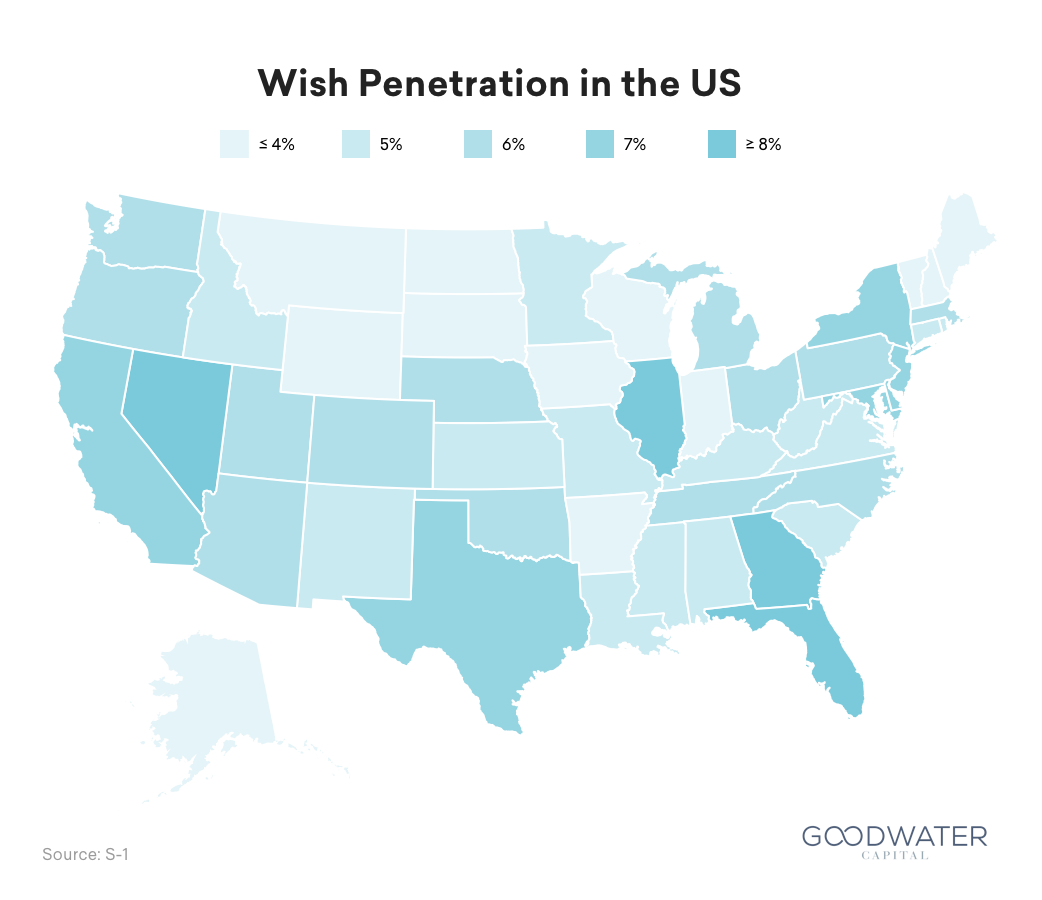
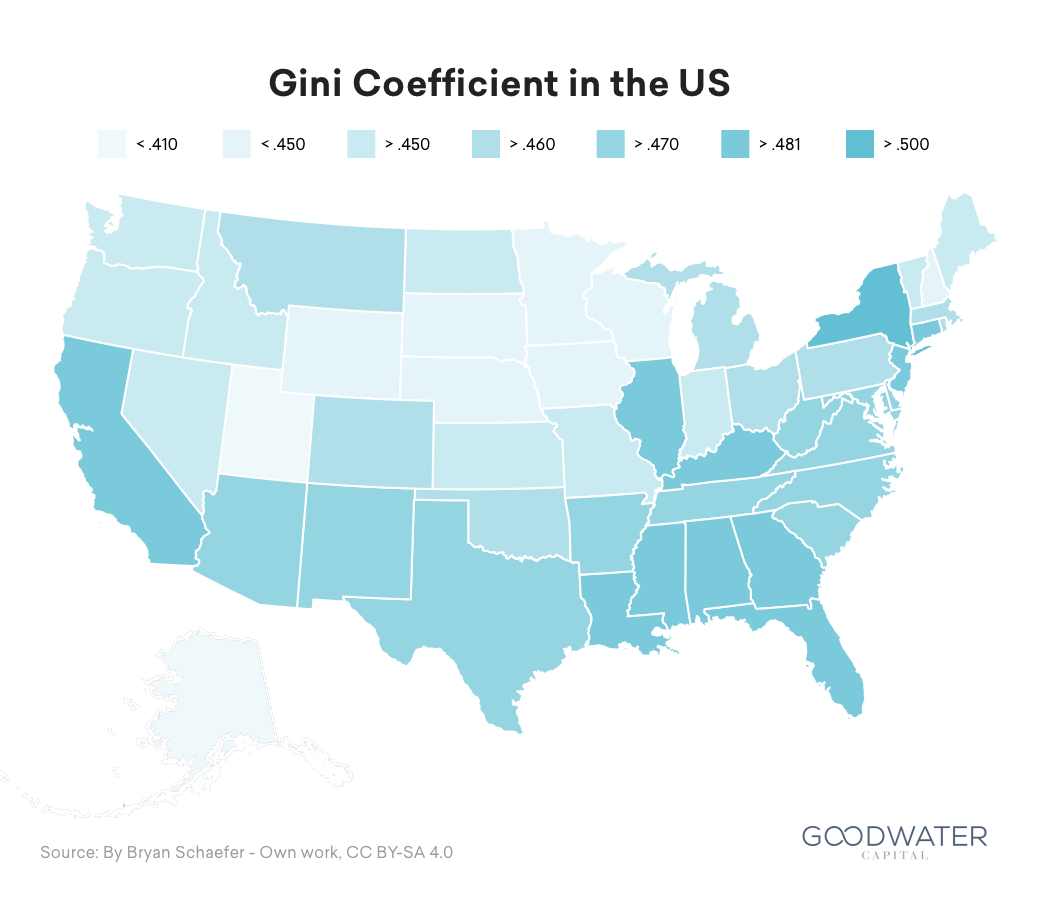
Wish recognizes that a significant population remains underserved, and understands that these consumers are focused on price:
Affordable. Price is the single most important determinant when making a purchase for a substantial portion of the global population, and we aim to serve the affordability needs of these consumers. According to our survey of 2,850 consumers in select countries, approximately 75% of those responding prioritize the price of an item over brand and delivery time. Additionally, 95% of the survey participants who shop on Wish stated that they find items on Wish to be at a discount to branded alternatives.
Wish S-1
Wish customers are generally satisfied with the value proposition — so much so that it outweighs the upfront apprehension around the quality of products and the long delivery times on Wish:
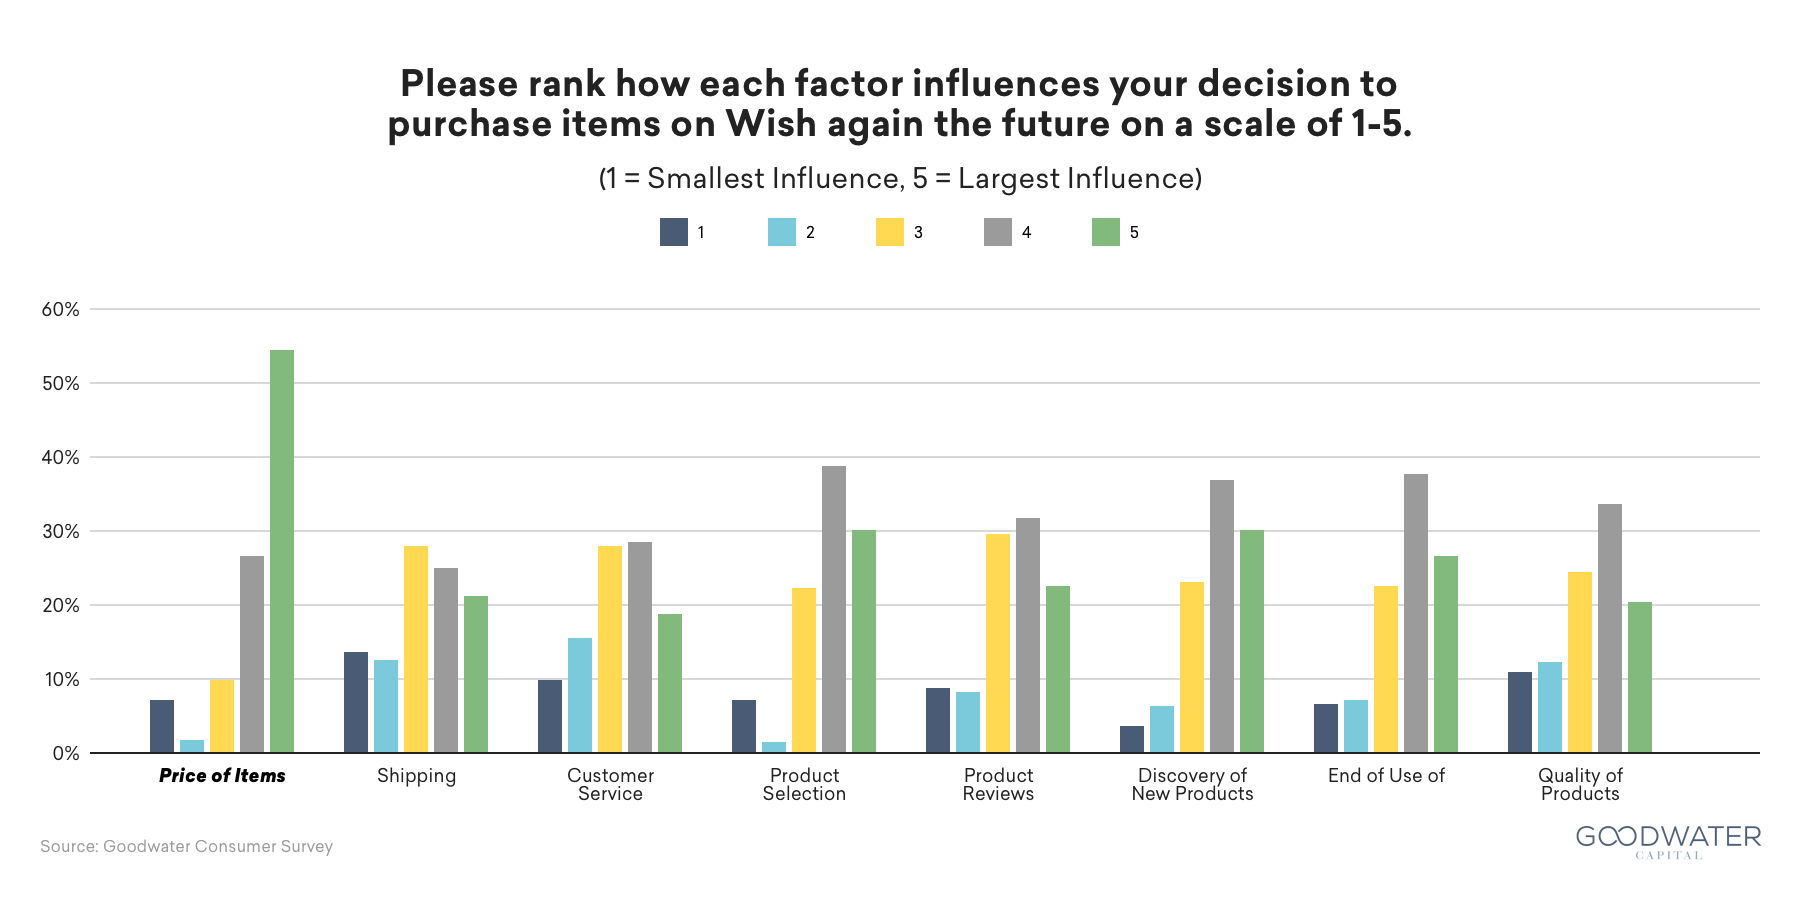
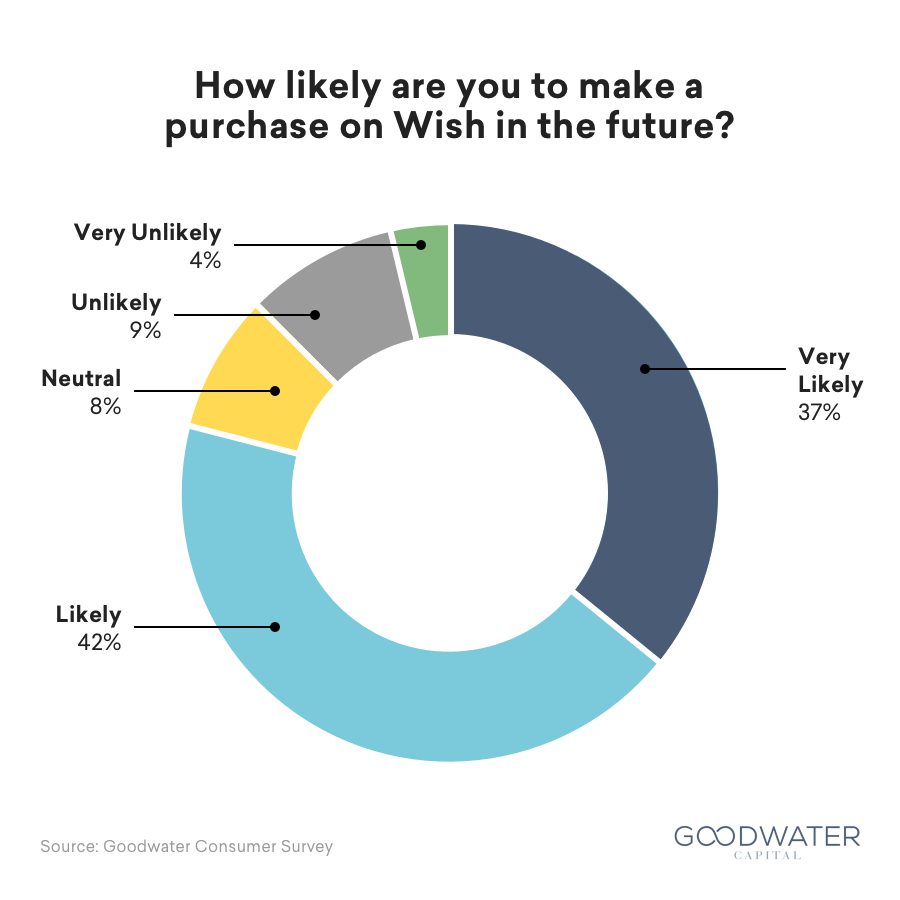
It's easy to criticize Wish for selling low-quality or counterfeit goods, but many consumers find reasons to come back to Wish for access to a wide variety of goods at very competitive prices.
Low Selling Prices Are a Small Needle to Thread
Even with a focus on an underserved market, it's not easy to serve this customer segment. A typical order is around ~$20–25 plus ~$5 in shipping, of which Wish collects 15%:
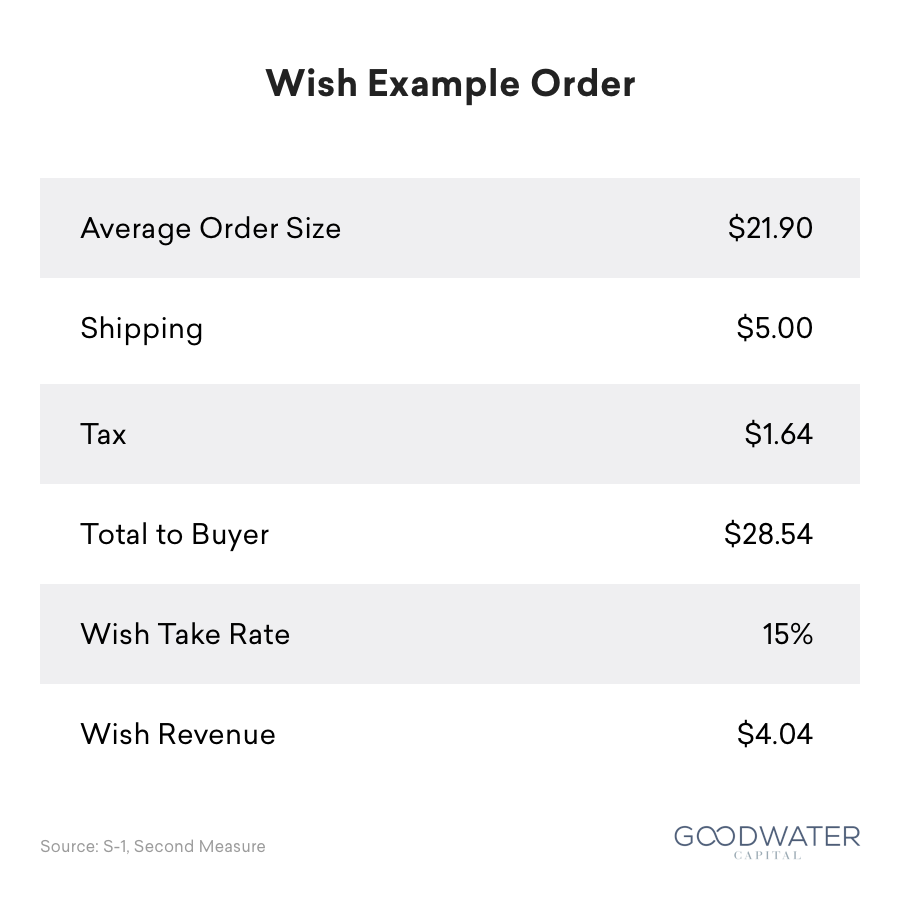
Lower average order values (AOVs) introduce a need to attract an even larger number of consumers, and a need to be efficient with marketing and advertising spend targeted toward the right people. Despite the challenges with selling to this demographic, Wish has been successful in finding the customers and acquiring them.
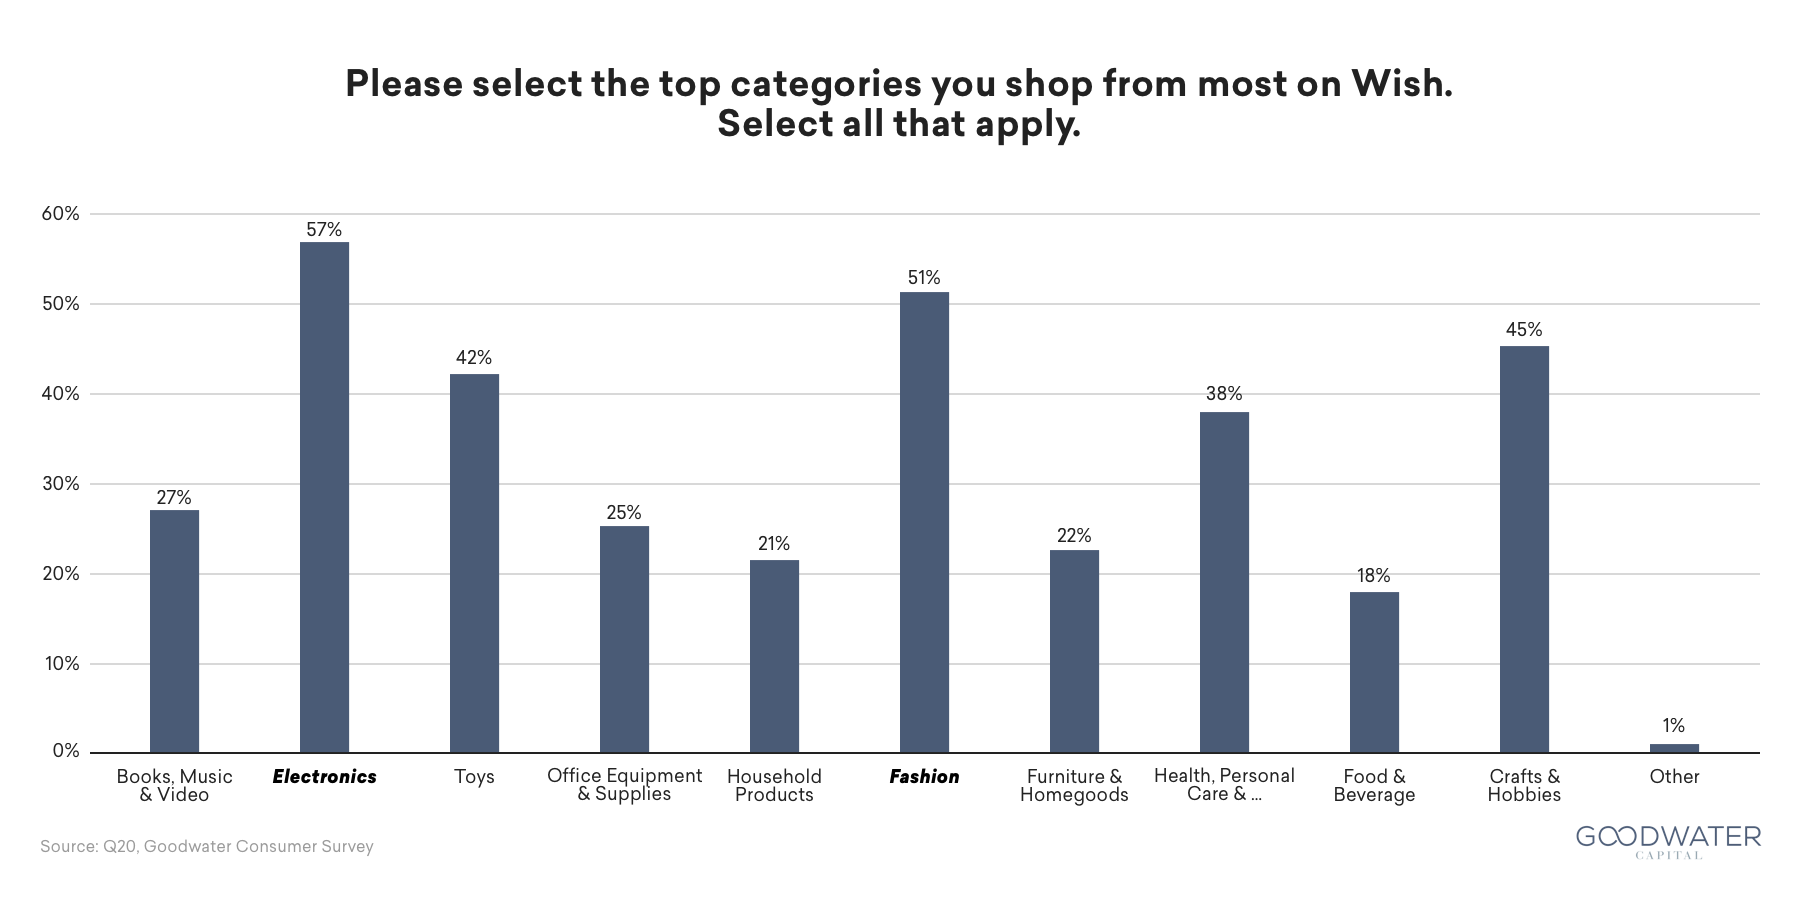
Survey results indicate that the two most popular categories on Wish are electronics and apparel:
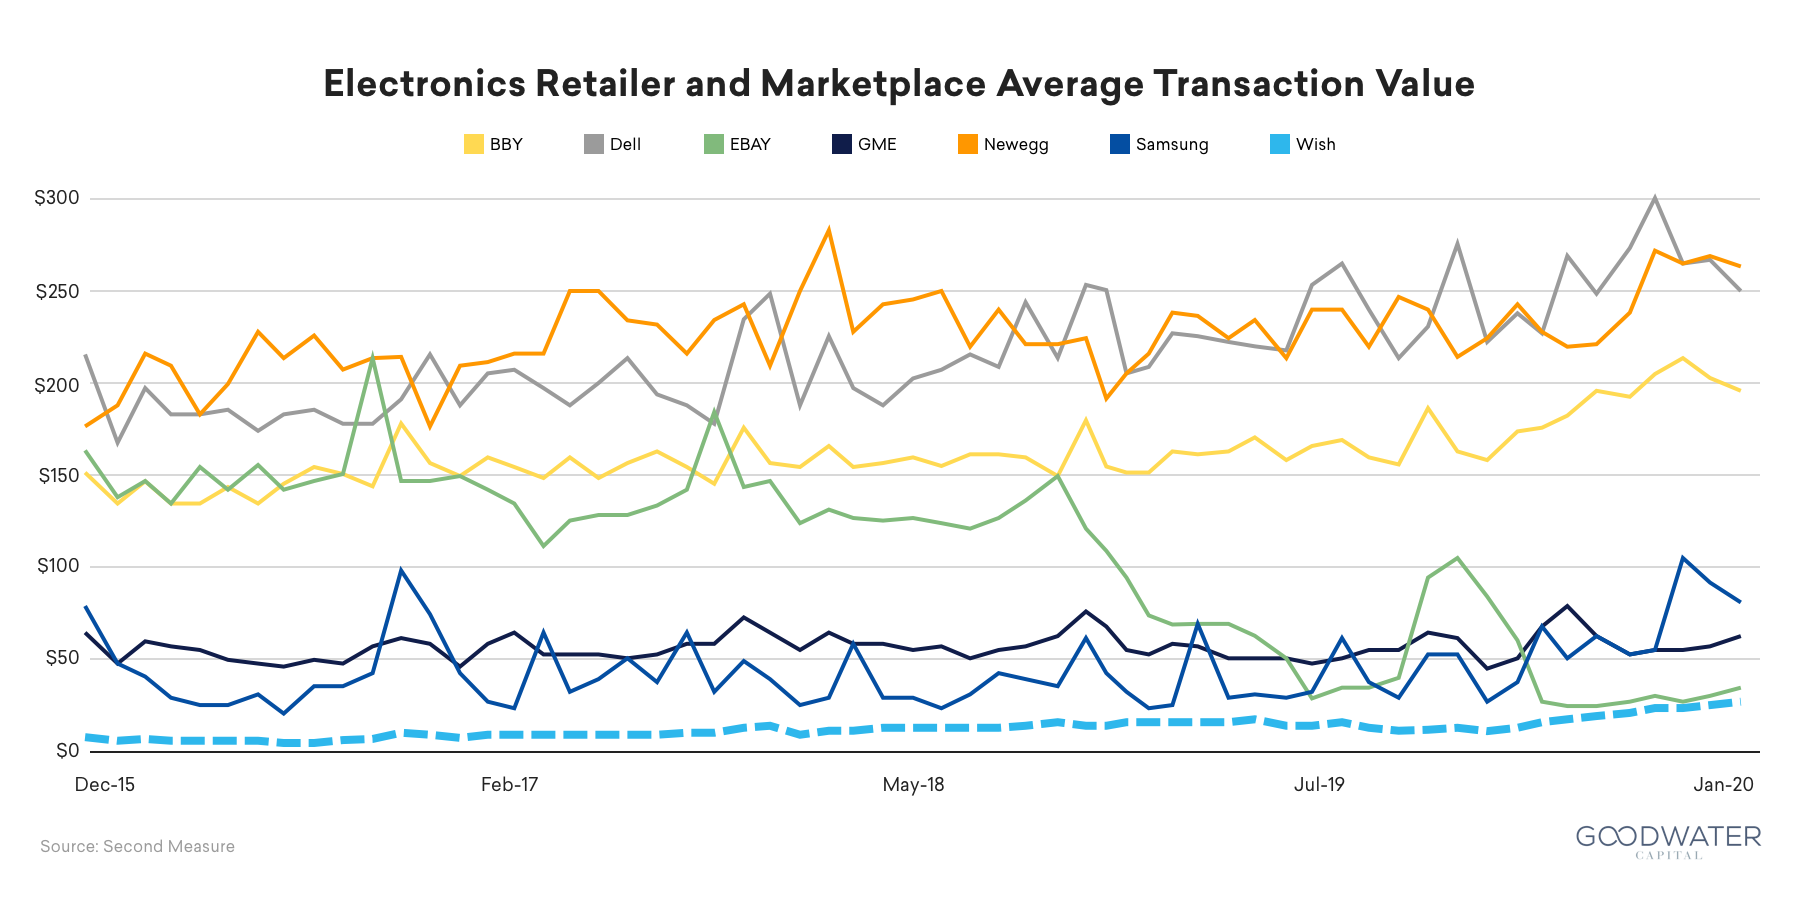
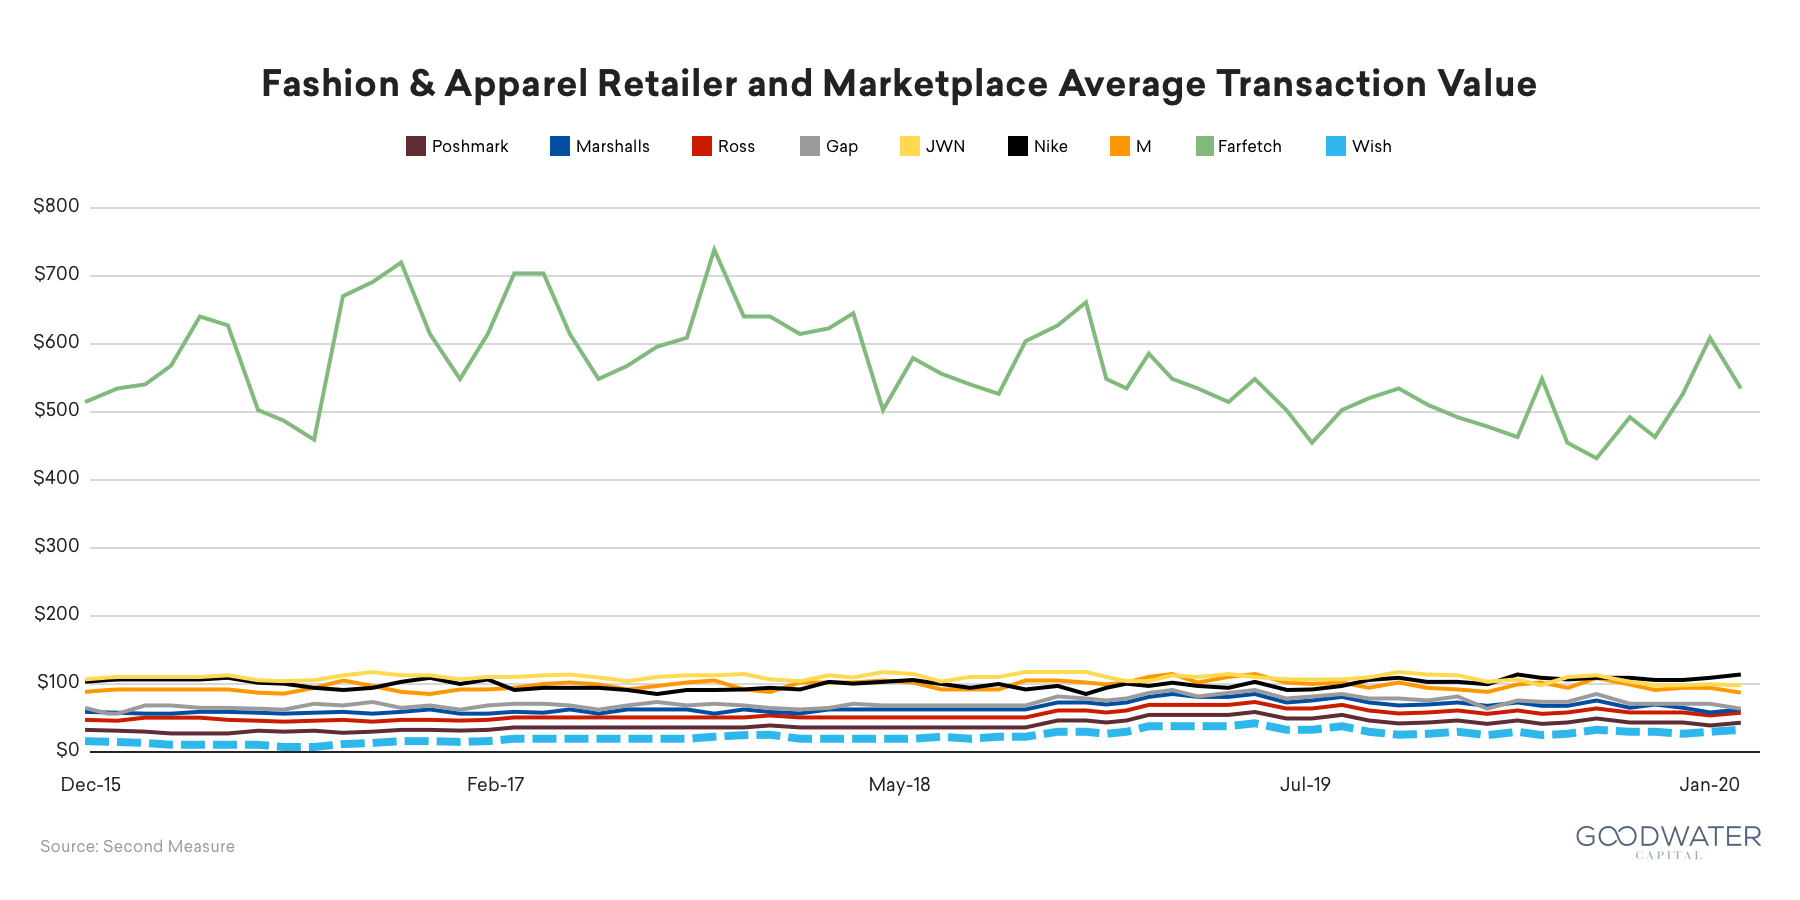
Comparing Wish to other sellers, Wish consistently has one of the lowest AOVs:
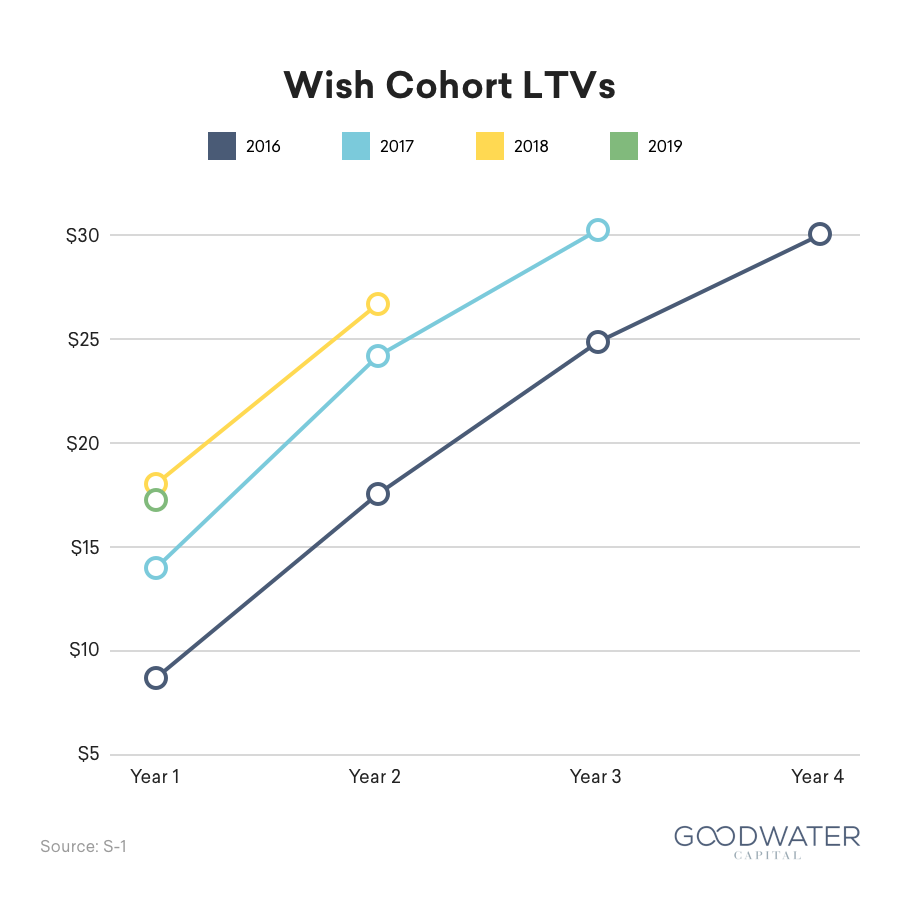
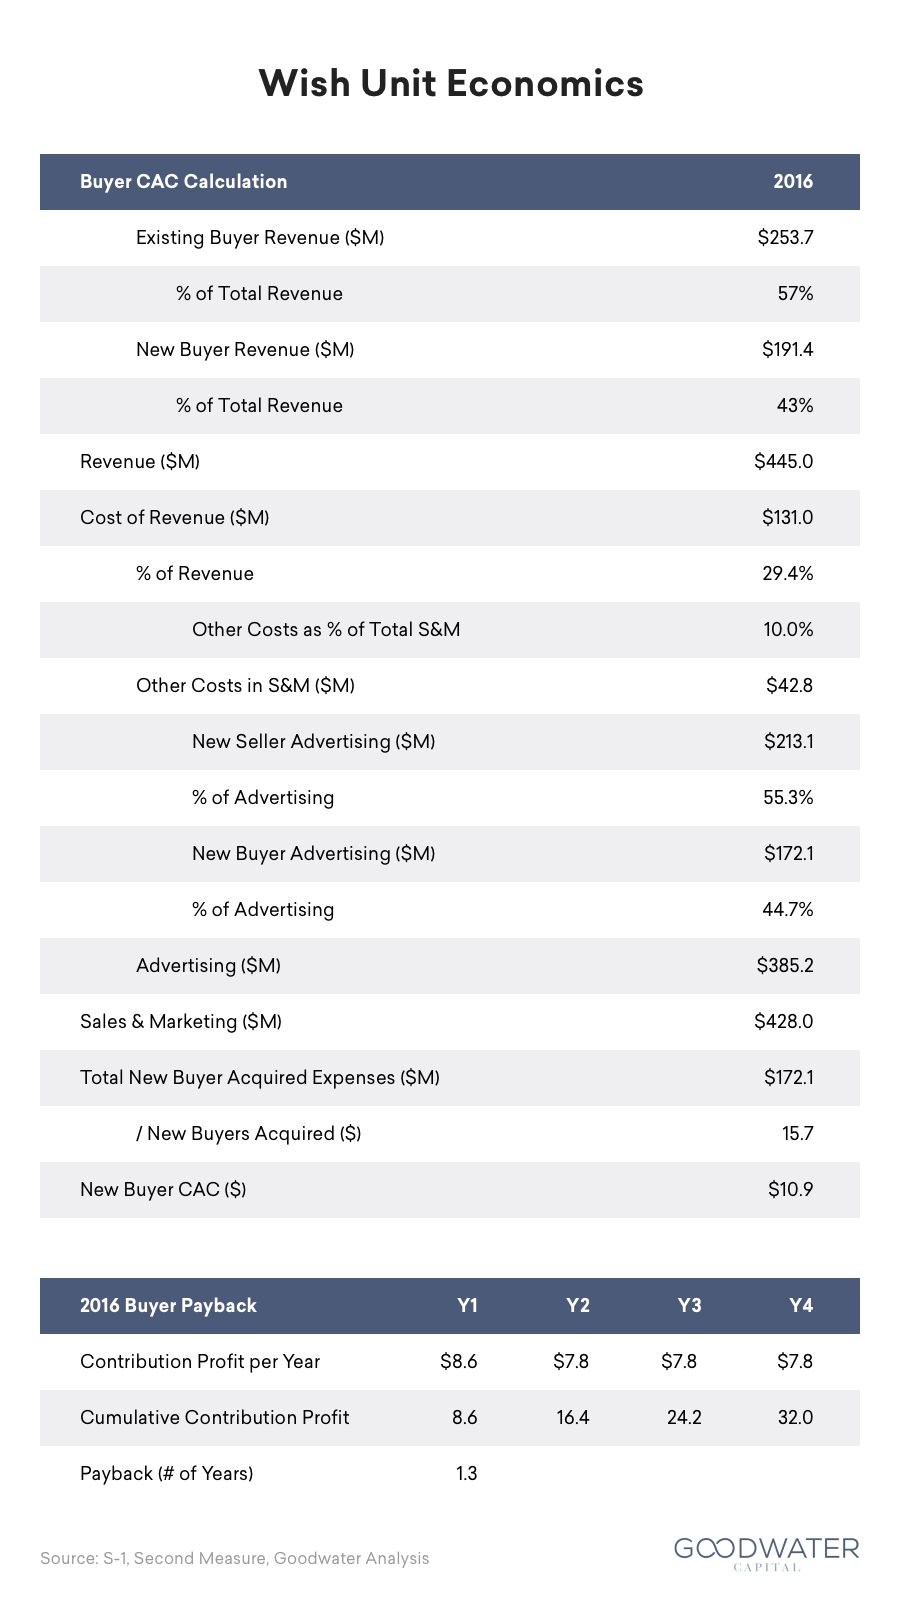
Low AOVs can make the unit economics challenging. Despite that uphill battle, Wish has been able to achieve favorable enough unit economics, with the 2016 cohort achieving 2.8x LTV/BAC (Buyer Acquisition Cost) off a ~$11 BAC:
That results in a 2016 BAC payback of around 1.3 years:
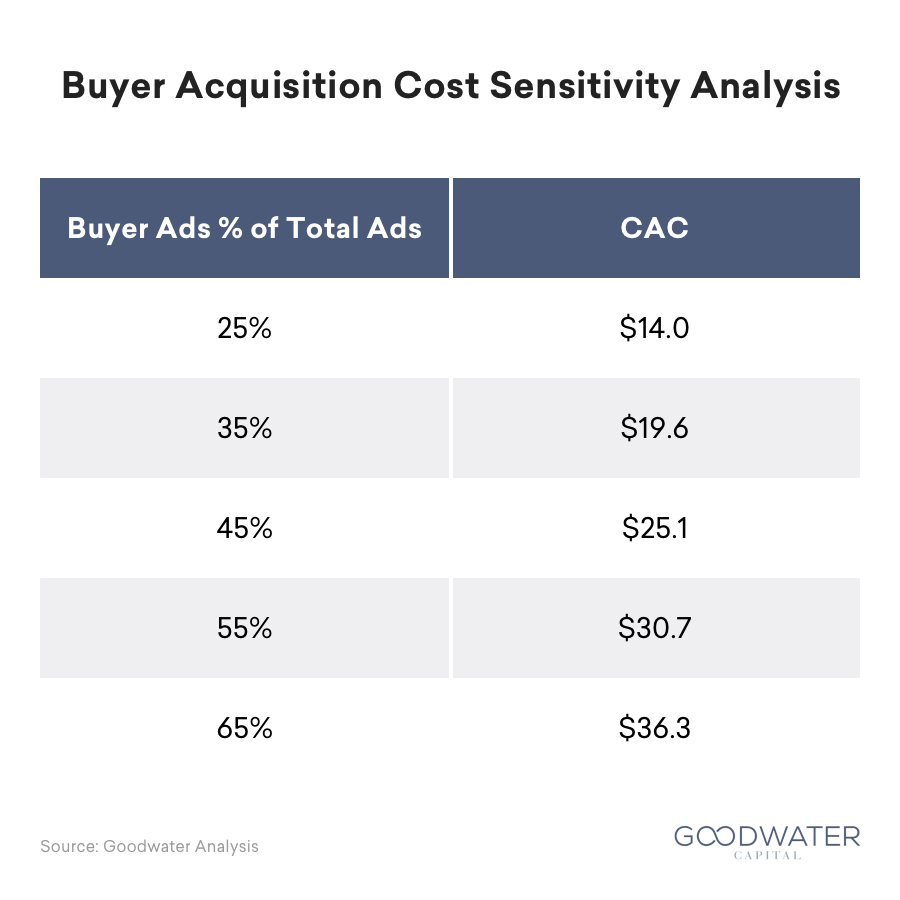
Extrapolating much of the data in the S-1, we can get a read on 2019 CACs. While we don't have an exact number, we can estimate a range by assuming a similar allocation to buyer advertising as in 2016. Buyer CACs appear to have risen roughly 2–3x, to ~$25–30:
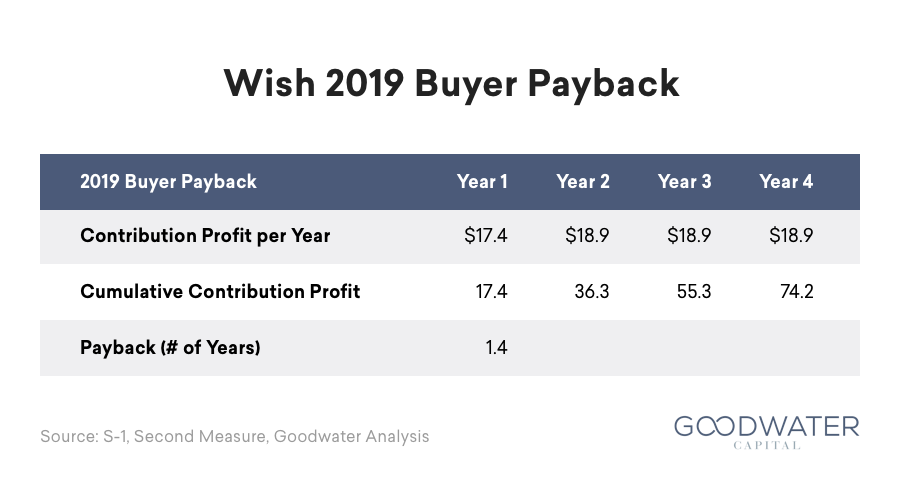
Despite this increase in buyer CACs, Wish has also been able to increase buyer LTVs by a similar amount, keeping their payback periods roughly the same at about 5–6 quarters, or less than 1.5 years:
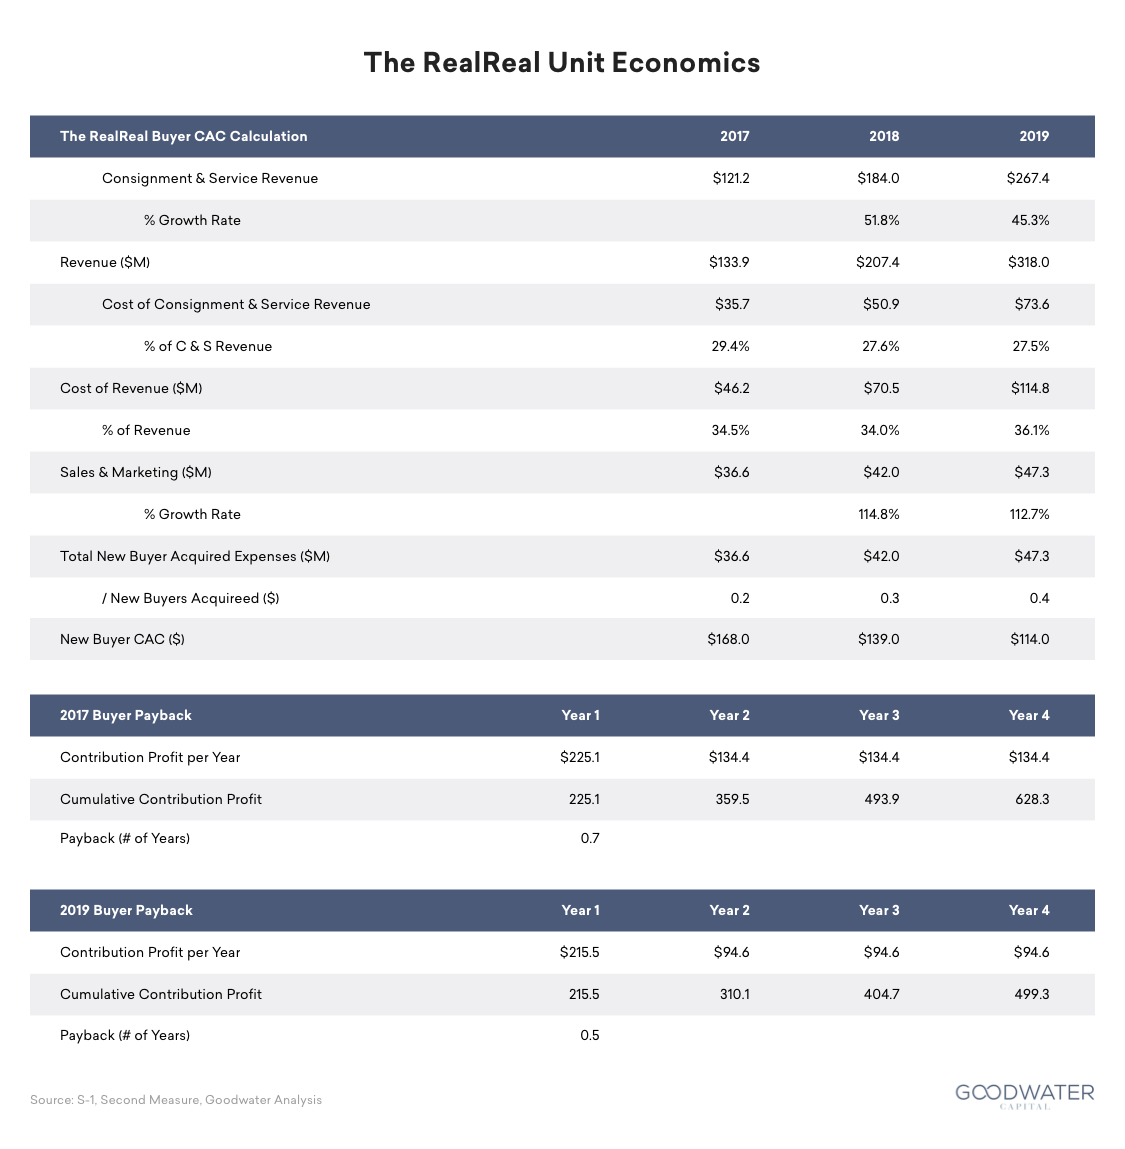
We can benchmark this to another recent IPO, The RealReal, which sits at the opposite end of the price spectrum, focused on luxury goods with AOVs around ~$450 — roughly 20x Wish. The RealReal's buyer CACs started in the ~$168 range in 2017, but the company decreased them by 32% over two years to $114 as it got more efficient and targeted with ad spend. The lower BACs significantly improved paybacks from 9 months to about 6 months:
Wish and The RealReal are great contrasting examples of how different marketplaces can be. They show how difficult a low-AOV category can be, but also how very different marketplaces can both be viable with the right strategies and products adapted to serve very different types of consumers.
Marketplace Benchmarks Are Highly Category-Dependent
As demonstrated by Wish and The RealReal, retail marketplaces — while commonly grouped together — are actually quite different from one another. Gauging operational performance and benchmarking properly requires comparing to the right marketplaces.
Starting with Wish, Year-1 (Y1) customer retention (the percent of customers who make a purchase one year later) is 35%, and dollar retention (the spending one year later divided by the original amount spent) is 55%:
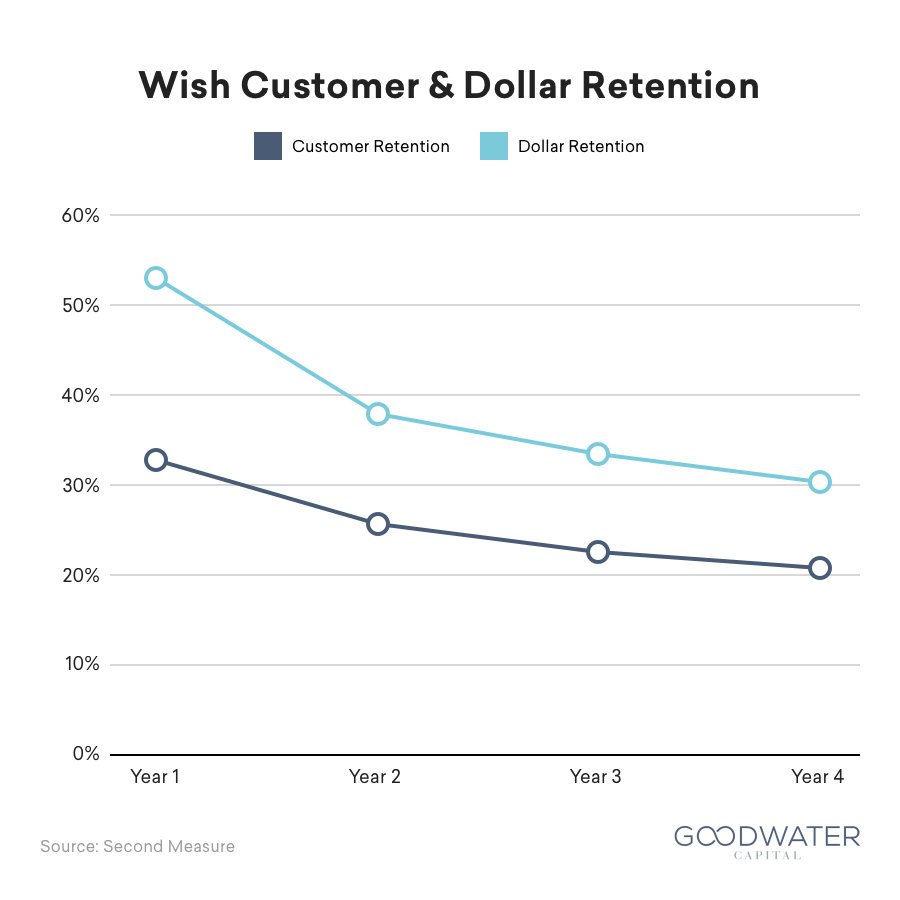
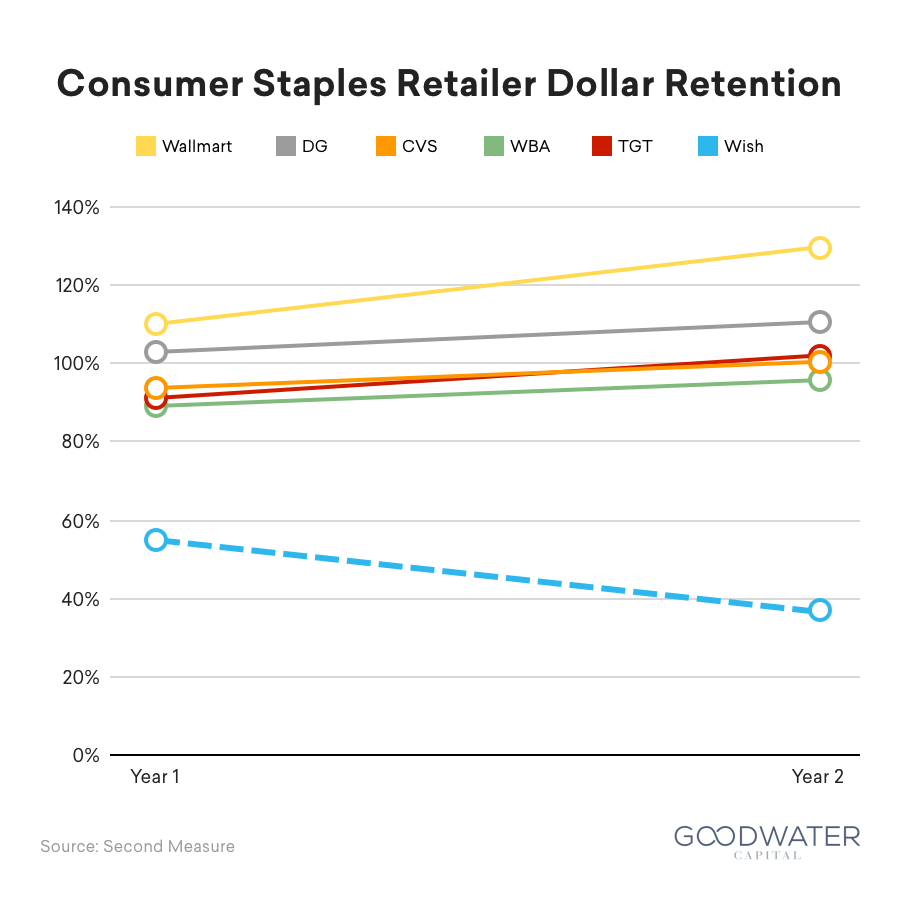
It would not be accurate to compare Wish to consumer-staples purchases, which tend to be smaller, higher-frequency buys with more constant demand. Those consumer-staples sellers, like Walmart or Target, have Y1 annual dollar retention easily over 90%, while Wish sits at 55%. The gap widens in Y2, with Wish dropping to 38% while the rest of the group stays in the 95%+ range:
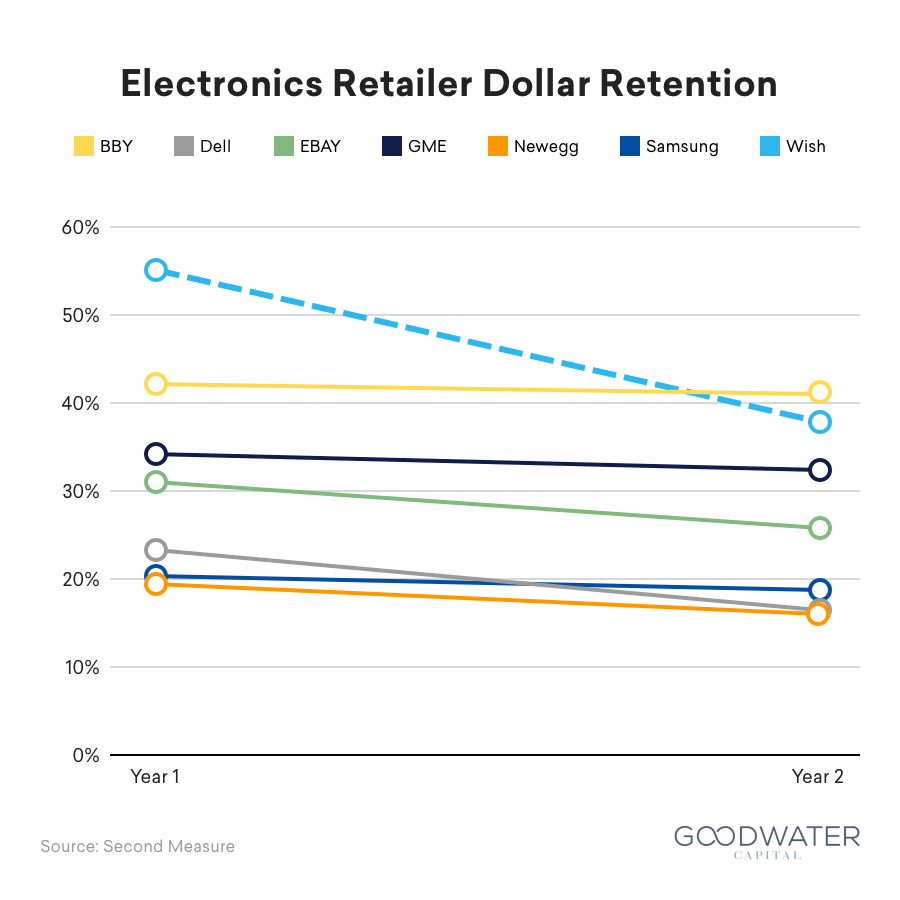
However, comparing Wish to electronics retailers and marketplaces shows that Wish is actually at the top of the group, where other electronics sellers have Y1 dollar retention in the 20–40% area. It is only in Y2 that Wish's performance is eclipsed by Best Buy:
Fashion and apparel tends to have higher annual dollar retention, at 40–60%. Wish starts in the middle of the range in Y1 and still manages to stay in the 35–60% range in Y2 (albeit near the bottom) with the other apparel companies:
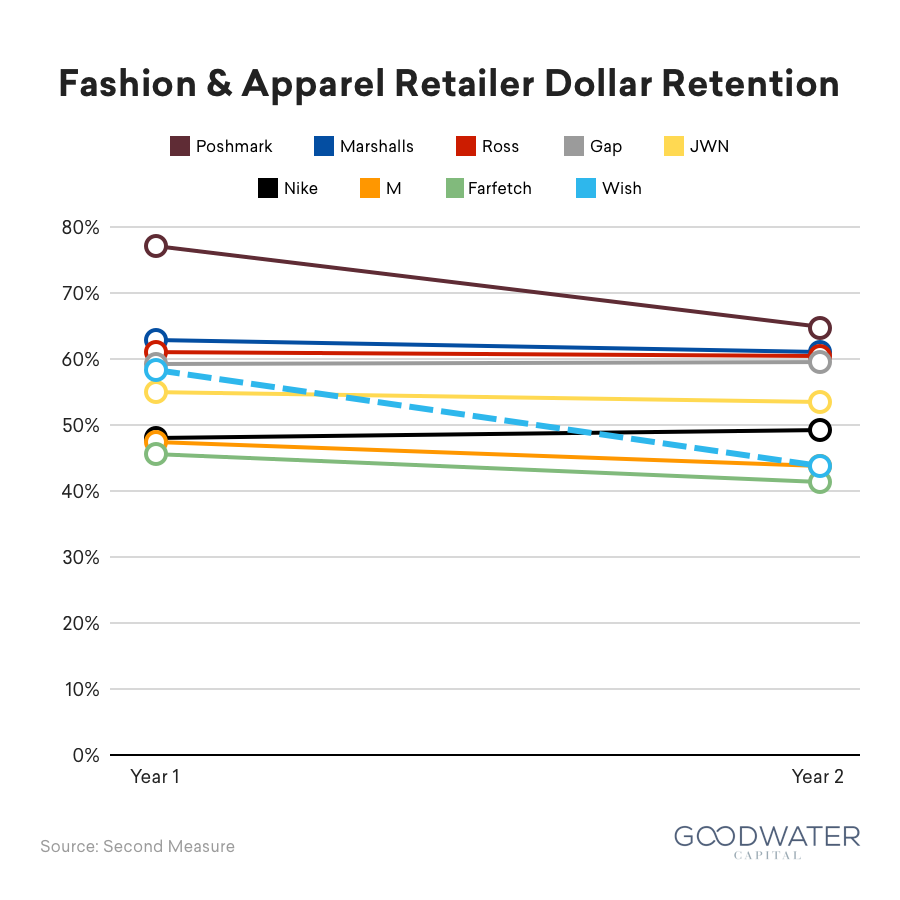
Metrics and KPIs like retention are defined by the category of goods rather than the marketplace itself. Entrepreneurs should be cognizant that benchmarks differ by the type of goods being sold, and should pick the right comparables to track success appropriately.
Wish also provides another important lesson in this regard — its move toward local has the potential to introduce new types of products, such as household staples, that could fundamentally shift the usage profile of the marketplace to something closer to everyday retailers like Walmart or Dollar General.
While Wish does have a number of challenges ahead, the company has done a tremendous job embracing its identity as a low-cost leader, and it continues to innovate to better serve its consumers.